9.1 Temperature
Sea surface temperature is one of the most monitored marine environmental metrics. This information is either derived from satellites, arrays of semi-permanent to permanent sensors, or project-based sensors. Project needs will help determine the most suitable data source. Sea surface temperature is reported in degrees Celsius.
9.1.1 Measurement Options for Temperature
9.1.1.1 Long Term Monitoring Data
Advances in remote sensing technology mean that sea surface temperature data are available in near real-time, all around the globe. This data is available at spatial resolutions of 9 km and 25 km.
9.1.1.2 In-Water Data Loggers
Hobo is a commonly used model of in-water data logger. These are relatively low-cost units that are installed on site to collect temperature data. More expensive units may also collect data on additional parameters (e.g., pH, light, etc.). Some models require a computer connection to read data, while others have wireless functionality and could be streamed in situ.
9.1.1.3 Monitoring Arrays
Many countries have now invested in real-time monitoring sensors or arrays in their coastal waters. These sensors are in-water measures of sea temperature and other parameters. Data is often freely available from the environment or ocean branch of your government (e.g., Australia – IMOS, Canada – DFO, ). If no local data is available, the International Comprehensive Ocean and Atmosphere Dataset (ICOAD) provides an open-source database at a resolution of 1 km x 1 km with monthly summaries of several key ocean metrics including temperature. This data is available as monthly averages and thus lag real time observations by two to six weeks.
9.1.1.4 Suggestions
If finer-scale data is required, projects can install their own continuous temperature monitoring unit. There are a number of these available on the market and projects should consider if they require real-time monitoring, the length of time the sensor will be left in the water, and of course, the project budget.
Handheld probes provide the greatest accuracy, but are expensive, and can only provide single time point results. Portable sensors are often less costly, can be left in the water for extended periods of time (i.e., months), are deployable at exact locations and depths, and once collected, provide continuous data from the study period. In addition, fixed sensors can be installed near your study site, but require a fixed cable connection and may be best used off docks or other marine structures. While also expensive, they provide real-time information, do not need to be removed, and produce highly accurate results.
Projects will most likely want something simple and low cost, with continuous data, with reasonable accuracy. We suggest the use of portable sensors that can be installed at the restoration site and collected later. The main risk with these sensors is that if they leak or are dislodged, the data is lost. Therefore, we suggest you carefully consider where to locate them.
The second suggestion would be to look at the real-time sensor information. Sea temperatures are highly correlated and the sea temperature at one location is likely to resemble the temperature at another location. Therefore, if you do not need high-resolution data, we suggest you look at the remote sensing or array data available for your area. A key downside of the remote-sensing data is that it requires someone with GIS and remote sensing capabilities to process and interpret.
Maurer (2002) discusses remote sensing of temperature for users wishing to learn more.
9.1.2 Basic Instructions for Measuring Temperature
9.1.2.1 Installing a temporary water monitor
Preparation
Identify an appropriate location on the rocky reef that represents the area’s temperature conditions and is accessible for deployment and retrieval. Consider depth, water circulation, and potential disturbances (e.g., strong currents, boat traffic). Depths may vary, but consistency is important.
Set up the logger’s sampling rate, deployment start time, and any other relevant settings using the manufacturer’s software.
Assemble the mounting materials
Obtain a suitable mounting device, such as a stainless steel or PVC pipe, a metal or plastic mesh cage, or a heavy-duty cable tie. The chosen mounting device should be sturdy, non-corrosive, and resistant to marine growth.
Acquire additional mounting materials, such as marine epoxy, zip ties, or cable ties, as needed for securing the logger and mounting device to the rocky reef.
Deploy the logger
Dive to the chosen location on the rocky reef, carrying the logger and any required mounting materials.
Clean the mounting area by removing any loose debris, algae, or marine growth to ensure a secure attachment.
Attach the logger to the mounting area, ensuring it is securely attached.
Monitor and retrieve the logger
Periodically check the logger’s attachment and condition during any subsequent dives or using remote underwater cameras.
When it is time to retrieve the logger, carefully detach it from the mounting area and bring it to the surface. If collecting multiple loggers from a site, ensure their location is noted (e.g., by placing them in labelled bags or adding coloured zip-ties). Follow the manufacturer’s instructions for downloading the temperature data.
9.1.3 Projected Costs and comparison of methods
A Hobo water logger can be purchased for approximately $200 USD.
Each method of sea water temperature measurement has pros and cons for implementation (Table 26).
Table 26. Pros and cons for sea water temperature measurement options.
| Measurement Technique | Pros | Cons | Reference |
|---|---|---|---|
| In-Water Loggers (Hobo) | Site-specific Instant measures High accuracy | More costly | Onset Computer Corporation, 2018 |
| Long-Term Monitoring Data | Available worldwide Continuous data | Low resolution May be extrapolated to your site | International Comprehensive Ocean and Atmosphere Dataset, 2024 |
| Monitoring Arrays | High accuracy Continuous data | May not be set up near your restoration site | Integrated Marine Observing System, 2024 |
9.2 Salinity
Salinity refers to the amount of dissolved salts in water, measured in parts per thousand (i.e., PPT or practical salinity unit (PSU)).
9.2.1 Measurement Options for Salinity
The measurement options for salinity are the same as temperature (Section 9.1.1) with many of the probes measuring both metrics at the same time. Global open-source data measuring salinity is available with eight-day running averages at a spatial resolution of 70 km.
9.2.2 Basic Instructions for Measuring Salinity
See instruction for water temperature (Section 9.1.2).
9.2.3 Projected Costs and comparison of methods
Each method of salinity measurement has various associated costs (Table 27), as well as pros and cons for implementation (Table 28).
Table 27. Projected costs of each salinity measurement option.
| Method | Cost |
|---|---|
| Water Quality Multimeter | High |
| Salinity Tester | Low |
| Long-Term Sensor or Monitoring Array | Low |
Table 28. Pros and cons of salinity measurement options.
| Measurement Technique | Pros | Cons | Reference |
|---|---|---|---|
| Water Quality Multimeter | Site-specific Instant measures Highest accuracy | Very costly | YSI Inc., n.d.a. |
| Salinity Tester | Site-specific Instant measures High accuracy Much lower cost | Standalone unit Less accurate than a meter Surface sample only | Hanna Instruments, n.d. |
| Long-Term Sensor or Monitoring Array | Available worldwide Continuous data | Low resolution Distance to your location varies | Integrated Marine Observing System Data Network, 2024 |
9.3 PH Levels
pH measures how acidic or basic a substance or solution is. It is reported as a unitless number on the pH scale.
9.3.1 Measurement Options for pH
The pH of the water is either measured with a probe or a chemical reaction kit. The former can be done in situ, while the latter requires collecting a water sample and can be done in the lab.
9.3.2 Basic instructions for pH measurement
See water collection and measurement instructions in Section 9.4.2.
9.3.3 Projected Costs and comparison of methods
Each method of pH measurement has various associated costs (Table 29), as well as pros and cons for implementation (Table 30).
Table 29. Projected costs of each pH measurement option.
| Method | Cost |
|---|---|
| Water Strips | Low |
| Simple Probe | Low |
| Multi-Meter and Probe | Medium |
| Deployable Multi-Parameter Logger | Very High |
Table 30. Pros and cons of pH measurement options.
| Measurement Technique | Pros | Cons | Reference |
|---|---|---|---|
| Water Samples: Strip | Very cost-effective Simple | Least accurate real-time measurement, often in half-pH increments Location and day specific | Precision Laboratories, 2019 |
| In-Water Measure | Accurate if calibrated Precise location | Expensive equipment, sometimes extremely expensive Fine calibration needed Location and day specific | Surface: YSI Inc., n.d.a.; Submersible: YSI Inc., n.d.b. |
| GIS Layers | Large spatial distribution Historic time series | Historic averages Not specific to real-time conditions | Azab, 2012 |
| Water Samples: Lab | Very accurate Relatively affordable | Lab processing times Location and day specific | Robillard et al., n.d. |
| Arrays or Sensors | Time series data Accurate values | Restricted to sensor location | Rérolle et al., 2012 |
9.4 Nutrient Levels
Nutrient levels in seawater are typically measured by the concentration of nitrogen and phosphorus in the water. These measurements may be further broken down into measures of ammonia (NH4+), nitrate (NO3-), or phosphate (PO3-). While certain amounts of these compounds are required to sustain kelp growth and maintain a healthy ecosystem, nutrient concentrations that are too high can stimulate overgrowth of phytoplankton, bacteria, and other algae that reduce the clarity of the water column and reduce primary production. Further, when the biological material created by these bloom events decomposes, the oxygen levels in the water are significantly reduced and can result in anoxic zones that are inhospitable to life. Nutrient levels are reported in milligrams per litre (mg/L), parts per million (ppm), or micromoles (μmol).
9.4.1 Measurement Options for Nutrient Levels
9.4.1.1 In the Field
Certain probes can be calibrated to measure nutrient concentrations directly in the field (e.g., YSI Multiparameter Digital Water Quality Meter1, Hanna Instruments Environmental Monitoring Chemical Test Kit 2) but must be well-maintained and calibrated with each use. It is important to ensure that sensors are compatible with saltwater use. Using an in-water probe is the most accurate option.
Chemical test kits are a disposable, lower-cost alternative to a water probe. These kits work by combining a seawater sample with a catalyst and assessing the colour change to a known standard. These are common items for saltwater aquariums.
9.4.1.2 Lab Analysis
If you do not have a sensor, do not wish to invest in one, and want a very precise measurement, you may take water samples and send them to the lab for analysis.
9.4.2 Basic Instructions for Measuring Nutrient Levels
9.4.2.1 In the Field: Water Probe
It is best to make the probe measurements from a watercraft as to avoid disturbing the water. Similarly, sampling should be done from the front of the boat and before any divers or snorkelers have been in the water. Lower the probe into the water approximately one meter in depth and wait until the probe provides a consistent measurement over a five-second period. It is best practice to take multiple measurements across the extent of the kelp forest and generate an average value. If it is only possible to obtain a single measurement, it is best obtained from the centre of the kelp forest or restoration area.
9.4.2.2 In the Field: Chemical Kit
Follow the procedure described for the lab analysis to collect the water sample. After collecting the water sample, follow your chemical analysis kit’s instructions.
9.4.2.3 Lab Analysis
Collect your water samples in clean, sterile containers (e.g., plastic, metal, or glass). The sample is best collected from a watercraft to avoid contaminating the sample. Unscrew the top of your container, being careful not to touch the insides, and then place it as deep in the water as is feasible for your arm length. Once the container is full, pull it out of the water, empty it, and repeat this process three times. After the third fill, you may cap the container and place it in a dark, cool location (e.g., a freezer box). The water samples should then be sent to the lab for analysis.
9.4.3 Projected Costs and comparison of methods
See previous water quality cost estimates (Section 9.3.3).
Each method of nutrient level measurement has pros and cons for implementation (Table 31).
Table 31. Pros and cons of nutrient level measurement options.
| Measurement Technique | Pros | Cons | Reference |
|---|---|---|---|
| Field: Water Probe | Very accurate Can easily collect multiple samples per site | Very high initial cost Regular maintenance and calibration required | YSI Inc., n.d.a. |
| Field: Chemical Kit | Lowest cost per sample Can also collect multiple samples per site | Less accurate Single use only | Hanna Instruments, 2024 |
| Lab Analysis | Highest accuracy | High cost per sample Extended processing time per sample May be unavailable locally depending on lab capabilities | Robillard et al., n.d. |
9.5 Herbivory Levels
Kelp may be regularly grazed by herbivores such as sea urchins, snails, some fish, and abalone. Herbivory level is measured as the amount of kelp consumed per unit area per unit time. Reporting units are activity (bites per unit time) and/or weight (grams or kilograms consumed).
9.5.1 Measurement Options for Herbivory Levels
The most common way to measure herbivory in a kelp forest is by using assays. These are kelp materials that are transplanted to the site and collected after a period. Assays may also be filmed to determine the grazing rate and/or the identity of the grazers.
9.5.2 Basic Instructions for Measuring Herbivory Levels
Ideally, collect a small amount of kelp material from the same kelp forest in which you are interested in measuring herbivory. You may also use cultured kelp or kelp collected from a nearby kelp forest if required. One individual should be used per assay.
First, record the wet weight biomass of each kelp individual. After, you will transport the kelp individual to the study site and secure it to the seafloor. A quick and simple approach is to tether the individual to a lead weight and simply let it rest on the seafloor. Other approaches may use epoxy, bolts, or lines to secure the kelp to the seafloor. Assays are run over a short period of time, so the attachment method does not need to be highly secure. Assays may be run for hours to days depending on the herbivory level; higher herbivory rates require shorter assay time periods. If you are using video cameras, your camera’s battery life will be a limiting factor for assay time.
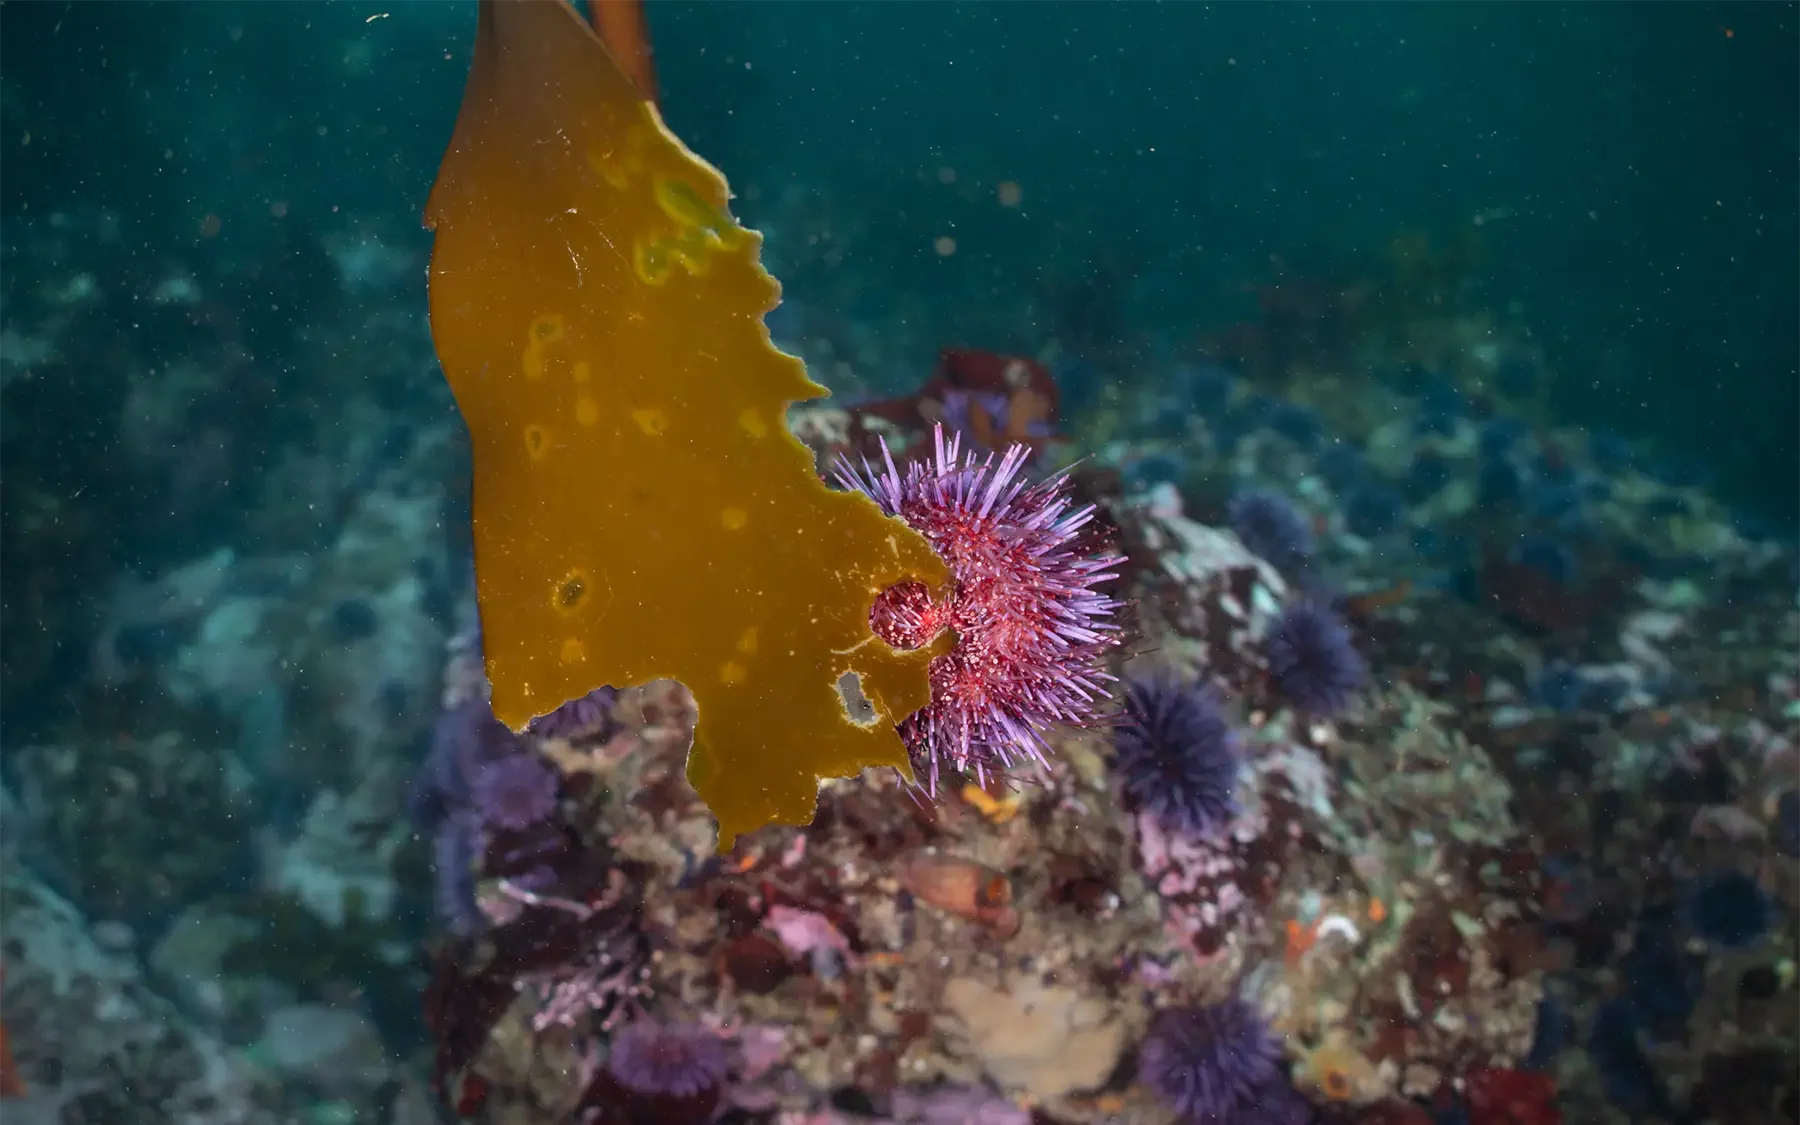
Once the desired time has elapsed, return to the location, collect the kelp, and record its new wet weight biomass. Subtract this value from the original biomass to determine the biomass that was grazed. Visual signs of grazing are small semi-circles and may be found on the exterior or interior of the blade (Figure 9).
If you are using a video camera, set the camera up so that it has a full view of the kelp individual and ensure that it is securely anchored on the seafloor. You can place cameras on the seafloor by using modified tripods or metal plates with camera attachments. After retrieval, you may review the footage to determine the species of the grazers and the bite rate per hour. For most purposes, the biomass consumed is the most important metric.
We suggest that multiple assays are completed per site and that they are sufficiently spaced apart. The assays may be placed inside or outside of the kelp forest.
9.5.3 Projected Costs
Costs are largely dependent on salaries and diver time.
Figure 9. Example of grazing signs on kelp.
9.6 Disease and Fouling
Disease, infection, or fouling manifests on the surface of kelp blades. Disease may be seen on the blade as discolouration, tearing, or coarse surfaces. Disease and fouling are reported as percent (%) of kelp blade fouled.
9.6.1 Measurement Options for Kelp Disease and Fouling
Kelp blades must be visually inspected to determine the level of disease or fouling. Ideally this is done in water as it prevents the removal of the blade, but if necessary, it may also be done on land.
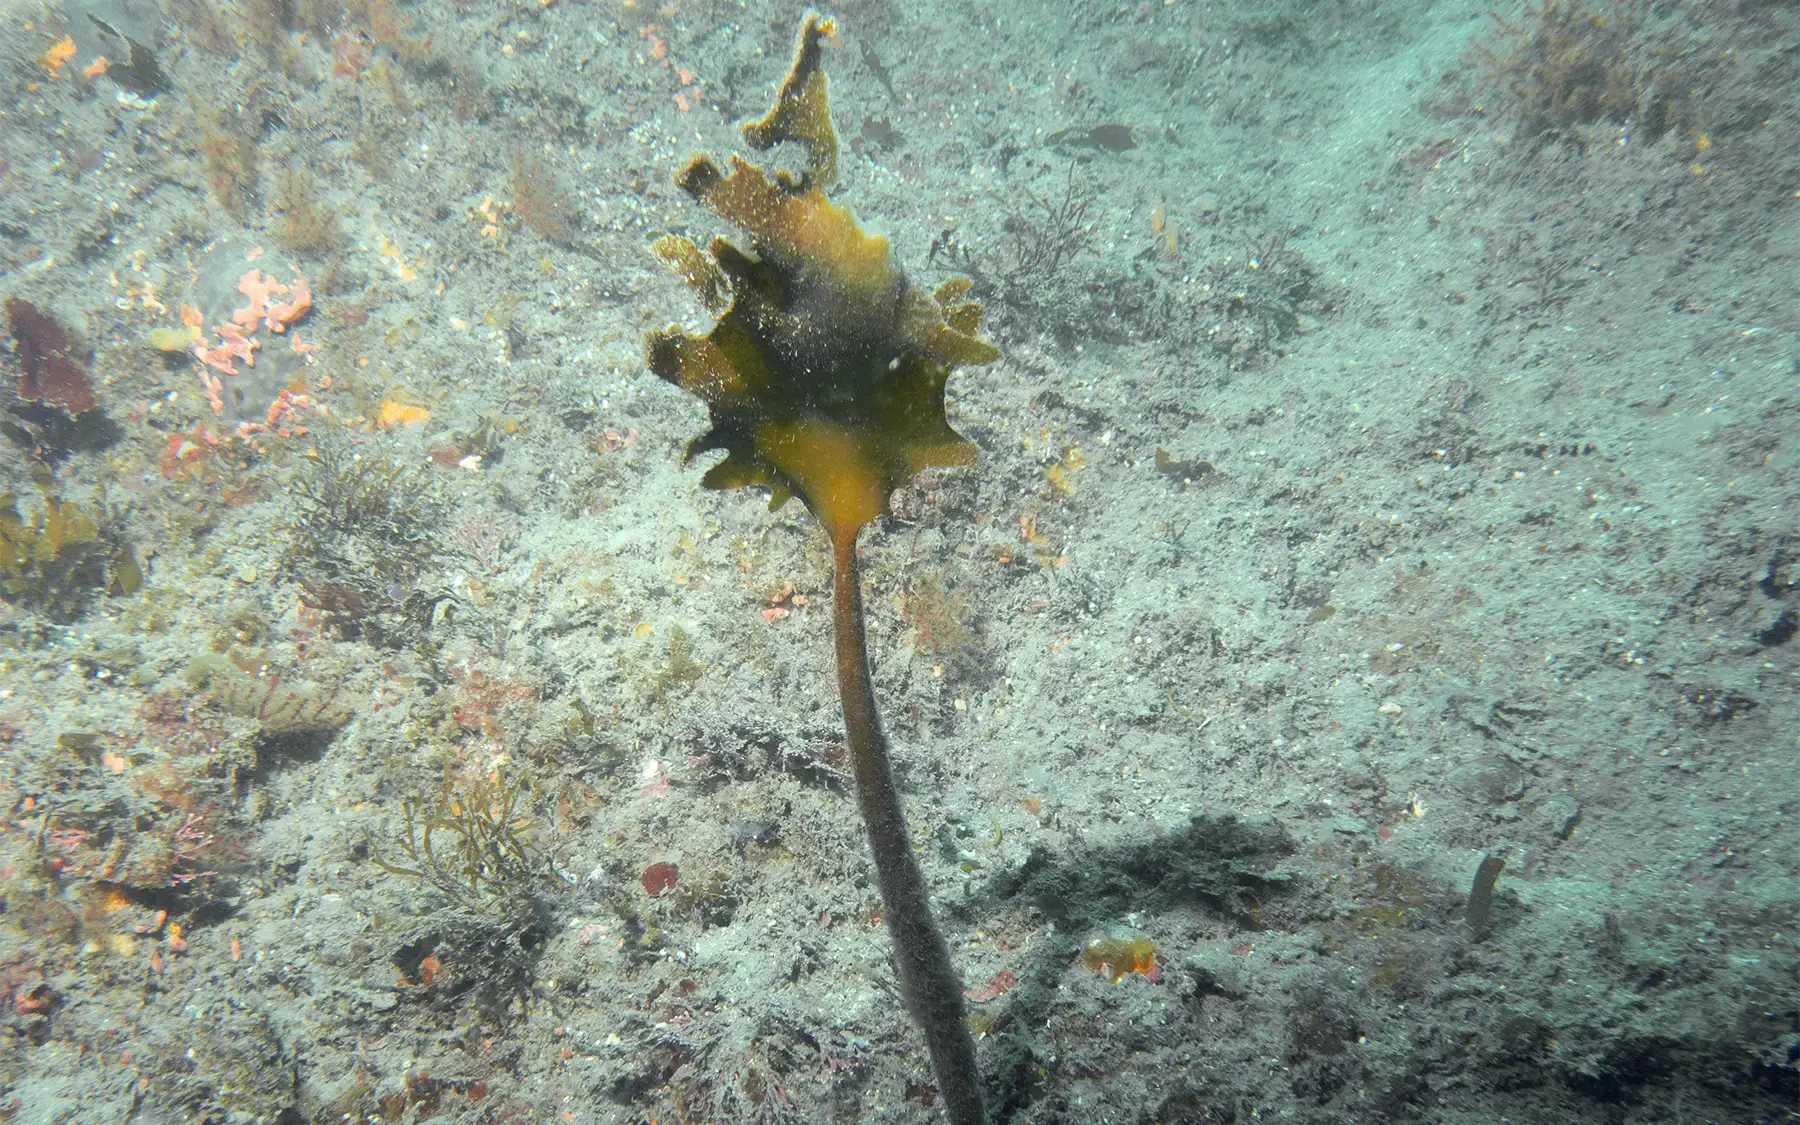
Make a simple visual assessment to determine what percentage of the blade is discoloured, fouled, or damaged (Figure 10).
9.6.2 Basic instructions for Measuring Kelp Disease and Fouling
Remove random kelp blades as described in the hole punch method section.
Visually assess what percentage of the blade is fouled or diseased.
