6.1 Primary Production
Primary production is defined as the amount of biomass that is created by an individual kelp or an area of kelp over a given period. It is reported in Net Primary Productivity or NPP, which is measured using a weight (e.g., grams or kilograms), area (e.g., m2, ha, or km2), and time (e.g., day, month, or year). The weight is usually dry weight, not fresh weight.
6.1.1 Measurement Options for Primary Productivity in Kelp
There are two main proxy measures of NPP in kelp: (1) the growth or elongation of the blade, also referred to as extension of the lamina, that assesses biomass accumulation over time, and (2) regrowth in cleared plots or restored areas.
6.1.1.1 Blade Elongation
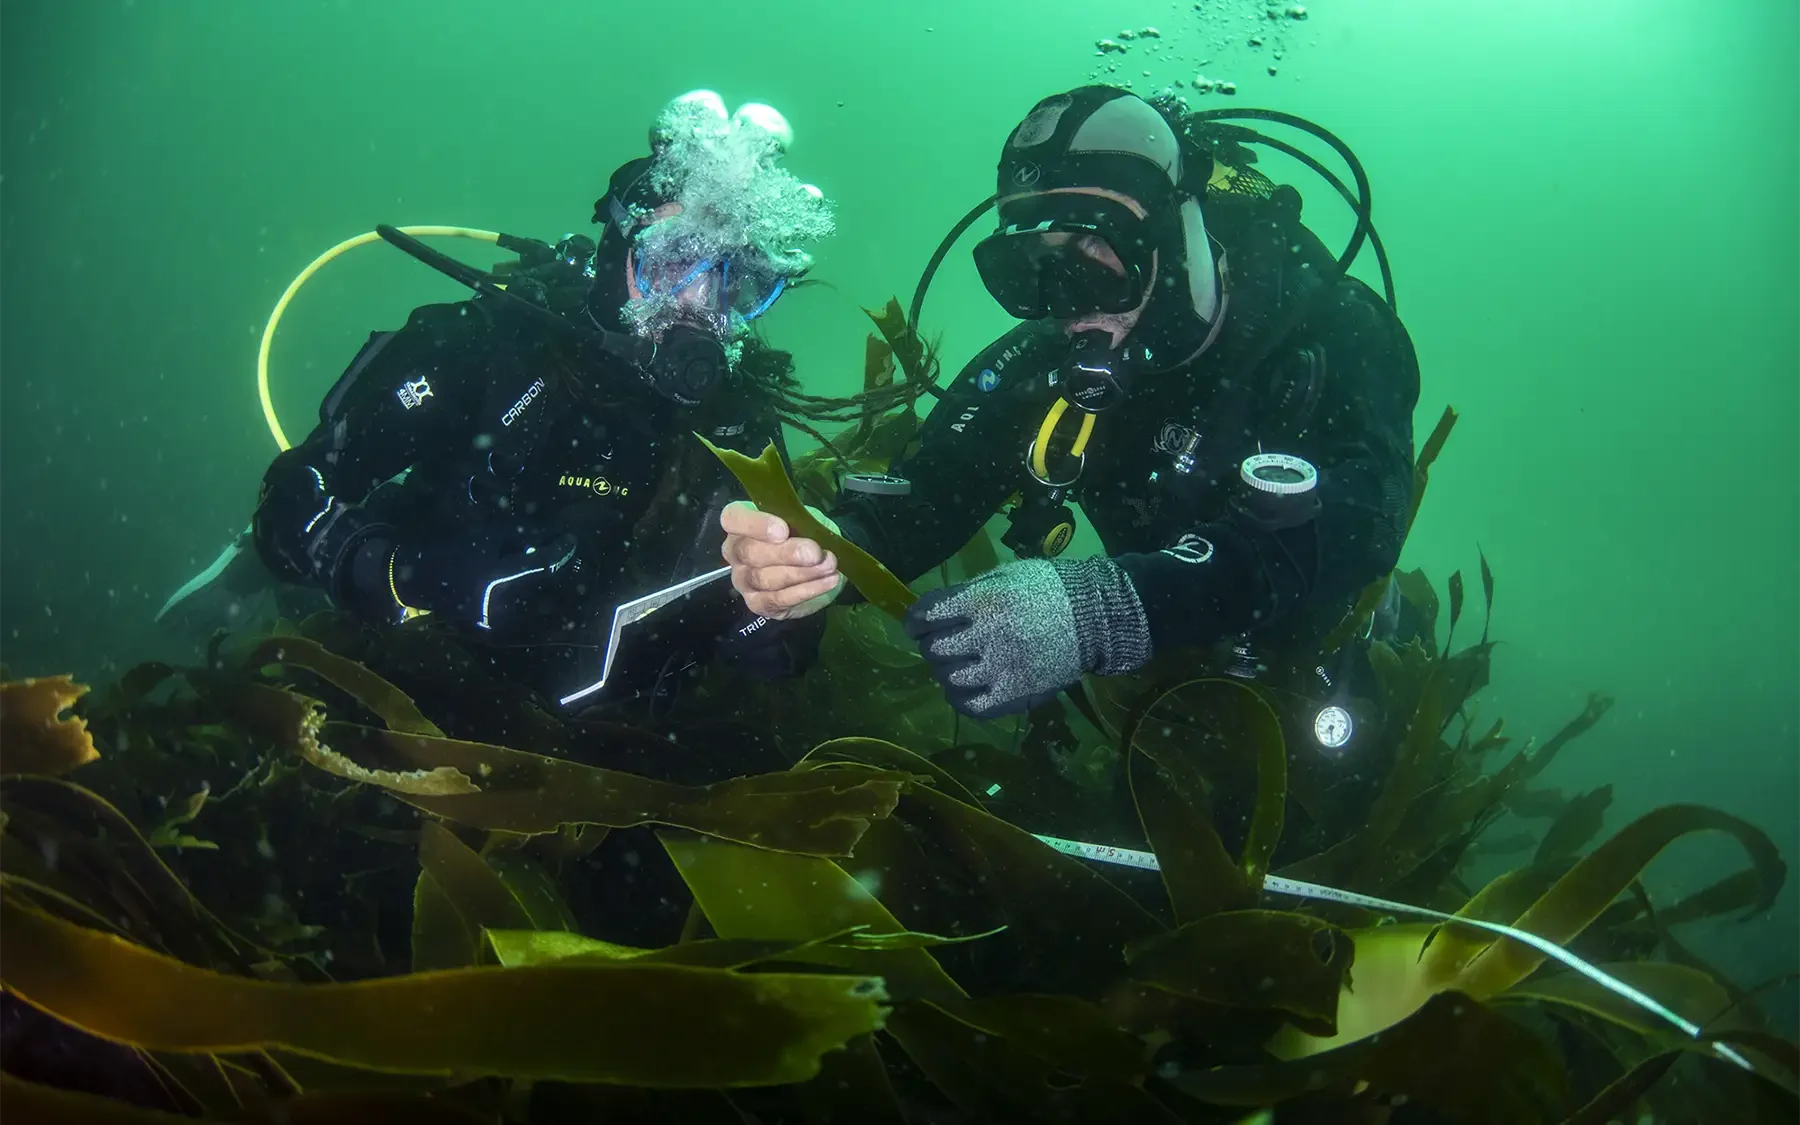
The elongation rate is estimated using the hole punch method 1. Briefly, this method requires users to randomly select kelp individuals within the forest and punch a small hole, about 5 cm in size, above the base of the blade (i.e., the meristem). Users then return months later, place another hole at the new base of the blade, and measure the distance between the two holes to determine how much the kelp has grown.
6.1.1.2 Regrowth
New growth in a restored area (year one)
If there was no kelp at your site before restoration, the first year of sampling will not require any kelp removal. Subsequent years will require removal or the hole punch method (Section 6.1.2.3). In the first year, you may simply remove a sample of kelp that has grown in the previously bare areas and assess the time since the restoration took place to get a growth rate.
Note that users should only remove kelp if the population appears healthy and can afford to lose an individual and may wish to use the hole punch method in restored or sensitive areas.
Regrowth in a cleared area (years two and above)
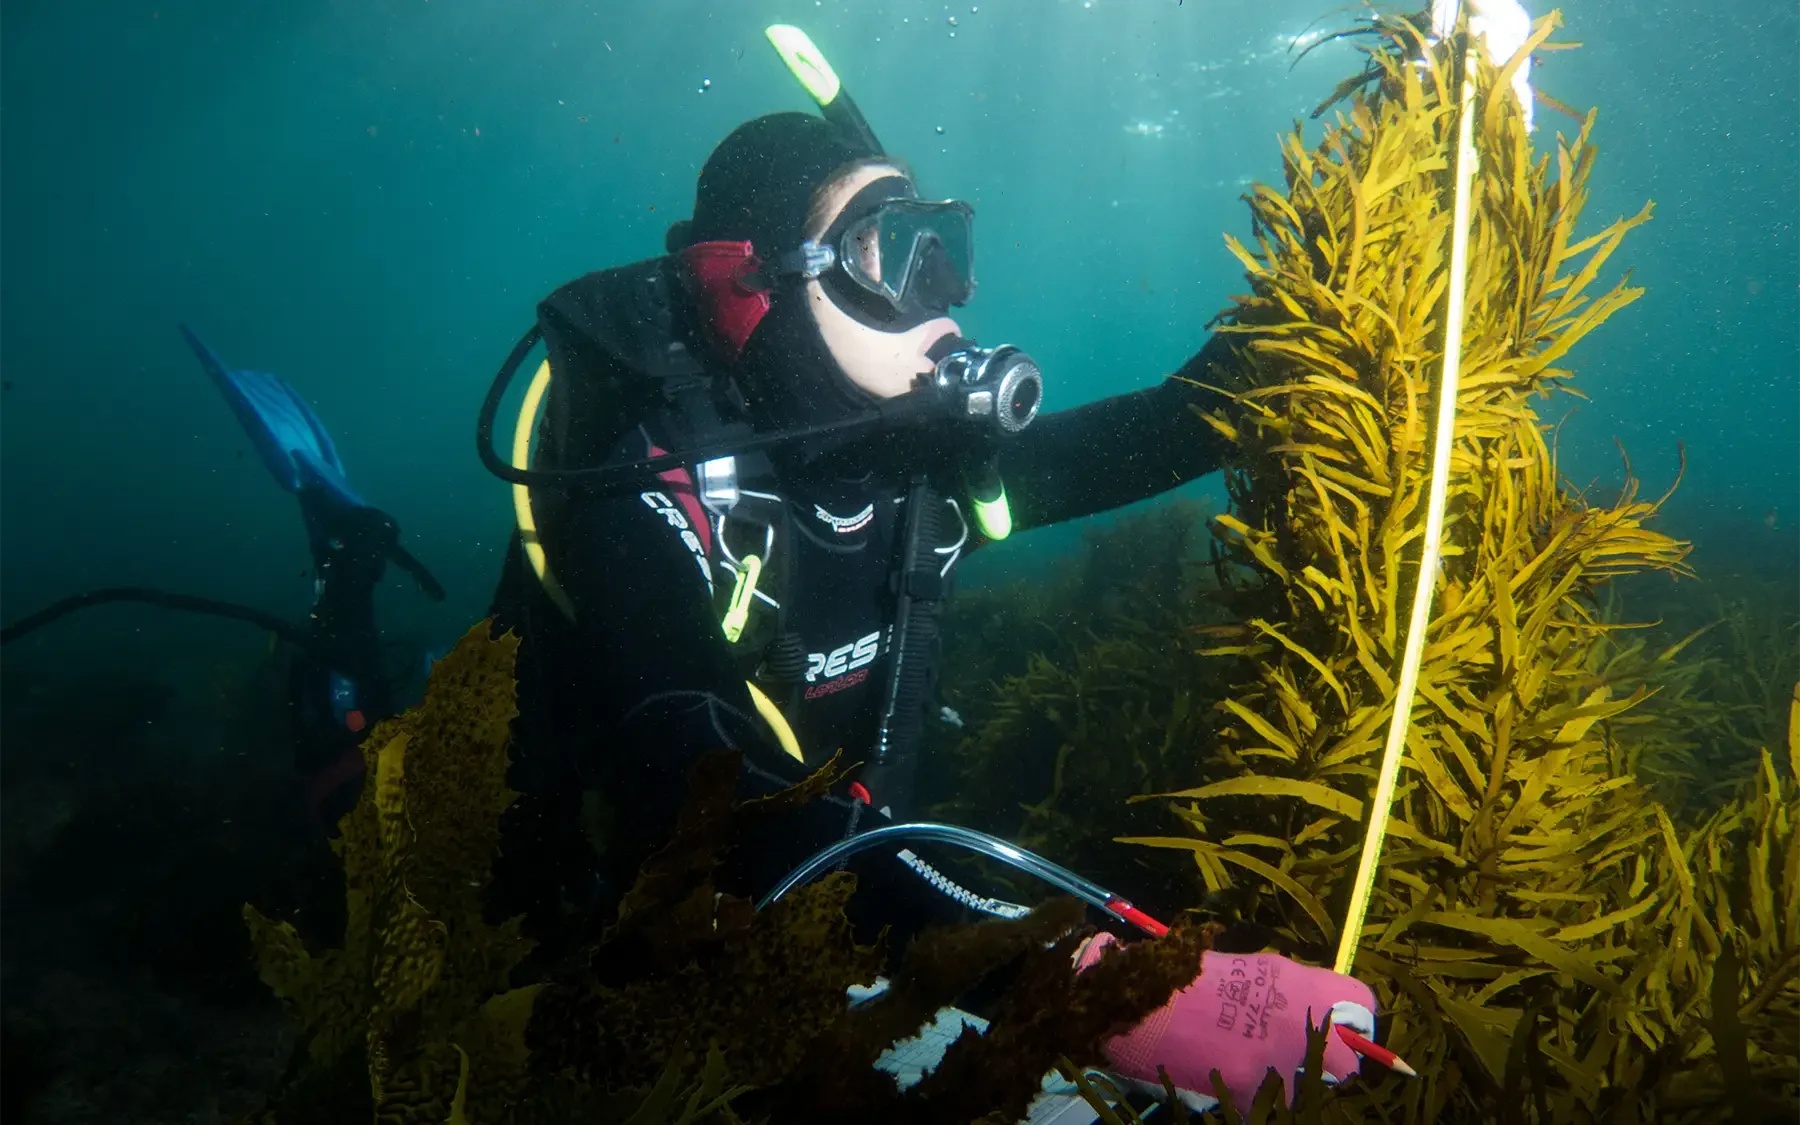
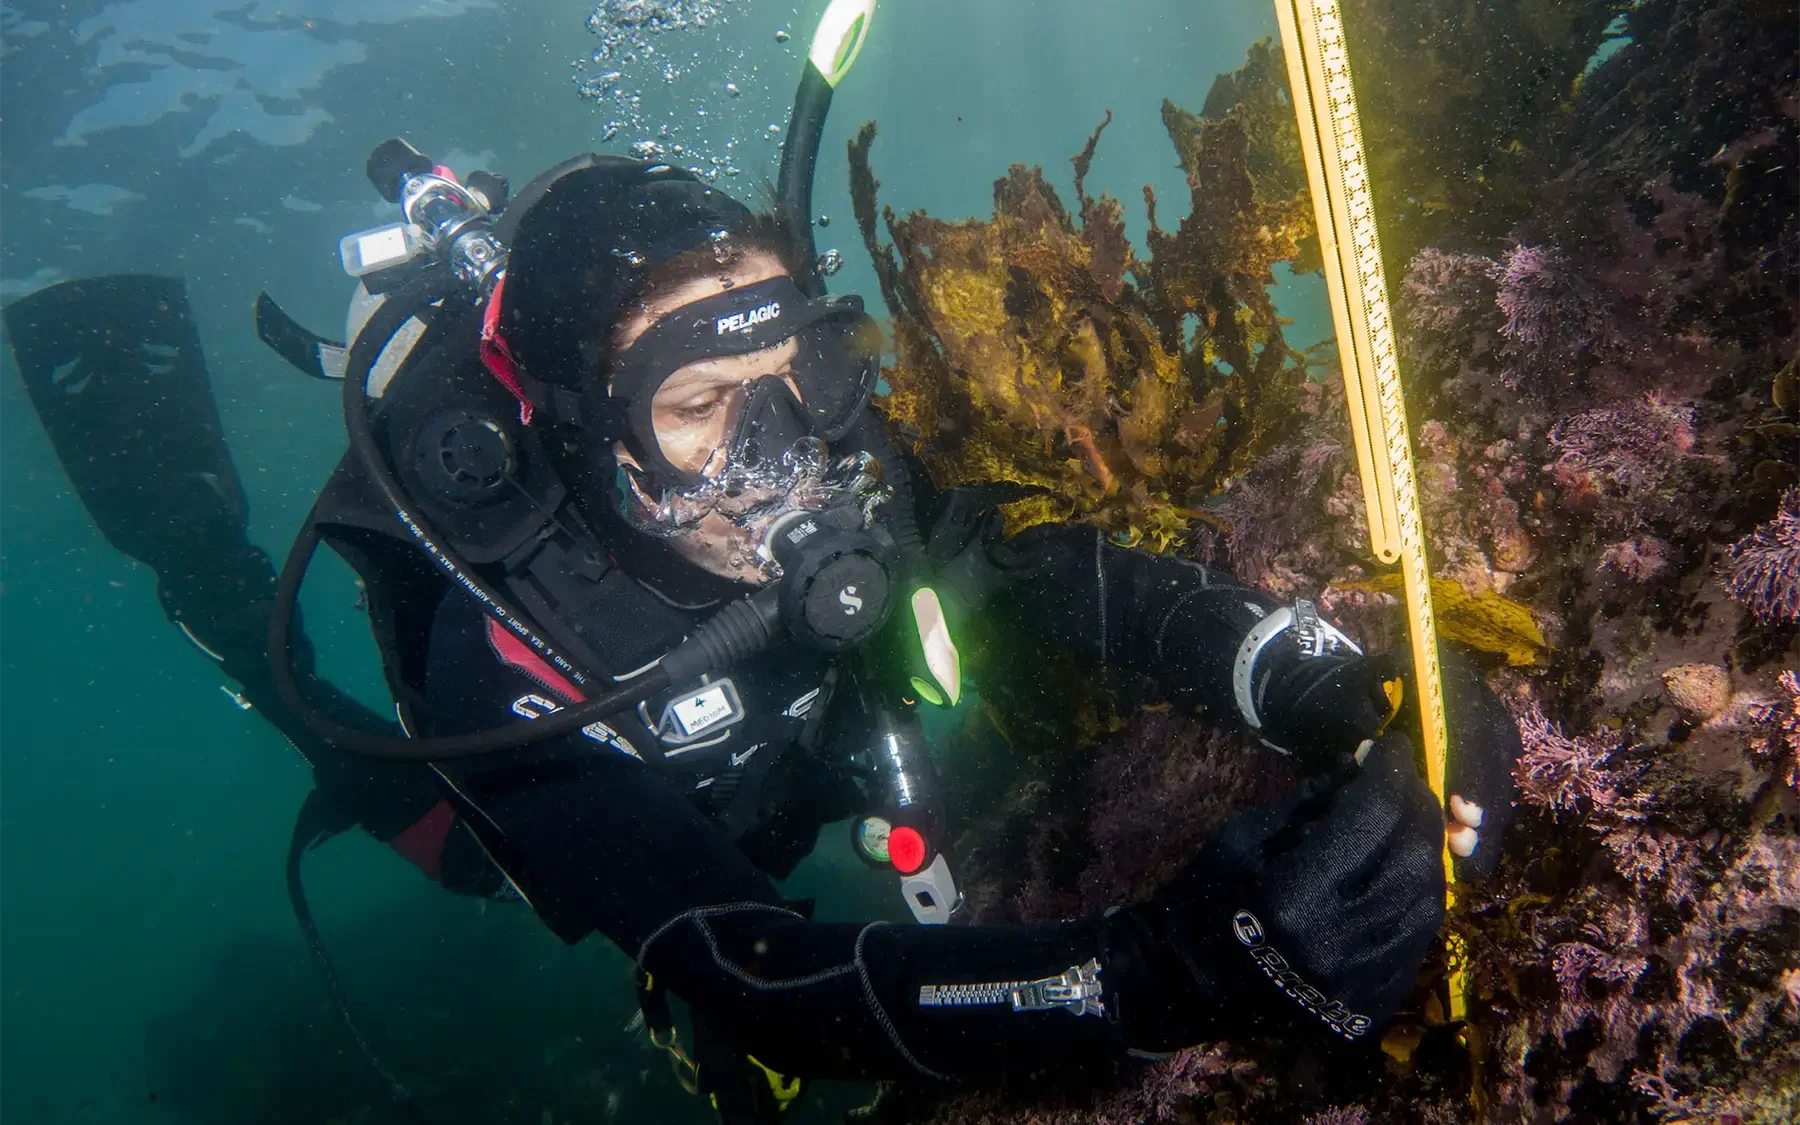
Users can measure NPP of kelp by clearing a defined area of reef (e.g., 1 m2) and then examining the biomass that regrows in a given period (e.g., one year). Users must clearly delineate the area of reef that is being cleared and re-measured. They may mark their areas with weighted floats, markers driven or drilled into the seafloor, waterproof paints, or coloured marine epoxy. This approach, measuring NPP of kelp by clearing the reef, requires significant time as the user must wait for the kelp to regrow.
In addition to these field measurement approaches, there are literature-based proxies that can be used. All these options are described in more detail below in Section 6.1.2.
6.1.2 Basic Instructions for Measuring Kelp Primary Production
6.1.2.1 Growth in a Restored Area
The following method assumes that prior to restoration, the substrate was bare rock. If there was kelp present before the restoration action, it will need to be cleared before using this method.
- Determine how many kelp need to be sampled. We suggest 10 to 30 per site. Fewer kelp may be sampled at the start if the number of individuals is limited.
- Divide the length of the transect by the number of kelp to get the number of kelp per transect.
- Divide the length of the transect by the number of kelp per transect to get the quadrat spacing.
- Follow the steps for running transects and quadrats as described in Section 3.2 and Section 3.3.
- Count and record the number of kelp in each quadrat.
- Remove a randomly- or haphazardly-selected kelp individual from each quadrat.
- Return the collected kelp to the lab.
- Scrape any fouling organisms from the kelp, such as other algae, bryozoans, etc.
- Pat kelp dry using paper towels, clothes, or newspaper.
- Record the wet weight of each individual.
- (Optional) Place individuals in a drying oven to determine the dry weight.
- Multiply the weight per kelp by the per m2 density to get biomass/m2 then divide this by the length of time since the restoration activity to get biomass/m2/year.
6.1.2.2 Regrowth in a Cleared Area
If you are clearing kelp from an area, note that the method is destructive; therefore, perform this method only in areas where kelp can recover and only after obtaining the correct permits and permissions. It can be potentially damaging to use this method for small, restored plots as it may destroy a significant portion of the biomass.
Select two to six random plots to remove kelp biomass:
a. Plots may be 1 to 8 m2 in diameter.
b. We suggest doing this in late summer, as much of the yearly growth has occurred by then. Winter is not recommended, as many kelps die back or shrink in the winter.
c. Space the plots 5 to 25 m apart.
d. Mark the plots with subsurface markers and surface GPS points.
Remove all the kelp plants from each plot:
a. Scrapers with wide, thin blades are a useful tool for doing this.
b. Users may wish to make a second visit to ensure that they removed all the kelp from each plot.
Assess yearly growth to determine if the plot has reached adult size. The return time will vary by kelp species and location, but is often one to three years.
a. Users should be sampling a mature kelp forest.
b. Use nearby healthy kelp forests to determine what reference kelp densities and individual lengths should be.
c. Time the follow-up visits to occur at the same time of year as the first clearing.
Take four to eight quadrats (0.25–2 m2 depending on kelp size and density) and randomly place them in the cleared plot:
a. Avoid the edge of the plot to avoid edge effects.
b. Count the number of kelp in each quadrat to determine kelp density.
c. Remove five to 20 kelp and bring them back to the lab to measure their wet and/or dry weight.
d. Determine a kg/m2 value.
e. Divide the value by the number of days or years between the initial clearing and the collection date to obtain kg/m2/year.
f. Convert fresh weight (FW) to dry weight (DW) using known FW:DW ratios (Wickham et al., 2019) for each species, or develop a site- and/or species-specific one by oven-drying the heaviest basal segment for biomass accumulation at 60°C for 48 hours, or until consistent weight is reached.
6.1.2.3 Hole Punch Method
- Start this work during the peak growth season for your kelp species and area, which is often early spring.
- Select a starting point in the middle of the kelp forest.
Take a GPS point and leave a marker on the seafloor:
a. Markers may be attached to the seafloor by tying ropes around features, or by gluing, drilling, hammering or otherwise securing a visible object to the sea floor. If the area is not extremely wave-exposed, you may weight a marker down using a large brick or other heavy object. These markers are not meant to float on the surface, but are used to help you relocate your location during follow-up monitoring.
- Haphazardly select kelp for sampling, ensuring 2 m between each kelp.
- Select a kelp at each sampling interval on the transect (e.g., every 2.5 m).
- Tag these individuals. Flagging tape, cable ties, colour elastics or other distinct items may be used to tag each individual.
- Place one hole punch at 5 cm from the base (closest to the stipe) of the lamina (blade) and place a second hole punch 10 cm from the base of the lamina.
Return any time within weeks to a year, and collect the marked individuals:
a. Ensure any markers are also removed.
b. Record the number of days between the initial punch and the collection date.
Return to the lab:
a. Measure the new distance of the holes from the base of the lamina (i.e., meristem).
b. Slice three 5-cm-long strips off from the widest part of the kelp blade and weigh them. Take the heaviest measurement.
Calculate the daily biomass accumulation as follows:
a. Biomass accumulated (BA) = eFW / 5 t:
i. FW = fresh weight of 5 cm strip (grams)
ii. e = distance of the holes from the base of lamina (cm)
iii. t = number of days between the hole punch and the collection of kelp
iv. BA = daily biomass accumulated, in grams of growth/day
Kelp does not grow evenly throughout the year, and therefore you will need to understand what percentage of its annual growth occurred during your sampling period to avoid overestimating annual growth. There are two options to assess growth in a year:
a. You may attempt to follow the same individual kelp for one year, but risk losing the individual if it is eaten or torn off the seafloor. Alternatively, you can conduct the hole-punch method during the main growth season and the low growth season to record the maximum and minimal laminal extension rates in the year.
b. You can also find published growth curves in the literature.
c. For example, you sampled from the beginning of spring to the beginning of summer (three months or 90 days):
i. The literature suggests that this period accounts for 80% of the growth.
ii. Get the annual growth rate by multiplying the biomass accumulated (BA) by dividing the number of sampling days (90) by the percent of growth (80). The equation to use is: Annual growth = Daily BA * (90/80).
Convert FW to dry weight (DW) using known FW:DW ratios 2 for each species, or develop a site- and/or species-specific ratio by oven-drying the heaviest basal segment for biomass accumulation at 60°C for 48 hours, or until consistent weight is reached.
6.1.2.4 Literature proxies
Past studies have established estimates for how the biomass of a kelp individual relates to its yearly production. These are known as “biomass to production ratios,” and they depend on the species, location, and yearly growing conditions. Therefore, users should take caution when extrapolating results. Nevertheless, using these ratios can save considerable effort and resources.
How to use biomass to production ratios
Obtain the biomass per m2.
Find previously published biomass to production ratios:
a. Find a ratio for your species or genus.
b. Attempt to find a ratio calculated in similar environmental conditions as your site.
Convert biomass (kg/m2) into production (kg/m2/year) using the ratio.
6.1.3 Projected Costs and Comparison of Methods
Each method of primary productivity measurement has various associated costs (Table 15), as well as pros and cons for implementation (Table 16).
Table 15. Projected costs for primary productivity measurement options.
| Method | Cost |
|---|---|
| SCUBA: Plot Clearing | High |
| SCUBA: Biomass Proxy | High |
| SCUBA: Chambers | Very High |
| SCUBA: Hole Punch | High |
Table 16. Pros and cons of primary production measurement options.
| Measurement Technique | Pros | Cons | Reference |
|---|---|---|---|
| Plot Clearing | More accurate | Destructive | Kelp Ecosystem Ecology Network, 2024 |
| Hole Punch for Blade Extension | Less destructive Lower cost | Must find exact same blades | Smale et al., 2020 |
| Chambers | Most accurate | Not scalable Expensive | Rodgers et al., 2015 |
| Literature Proxies | Fast Low-cost Scalable | Less accurate | Field et al., 1980 |
6.2 Carbon Uptake
Carbon uptake is defined as the amount of carbon taken up from the water and transferred into biomass. This value does not equate to the amount of carbon (C), or carbon dioxide (CO2) sequestered or captured. See Kelp Forest Alliance (2023) for a report on the link between net primary production and carbon sequestrations. Carbon uptake is reported in grams of C per unit area of kelp forest per unit time. Multiply by 3.66 to get values in units of CO2.
6.2.1 Basic Instructions for Measuring Carbon Uptake
The first step in calculating the carbon uptake is calculating the NPP on a dry weight basis. Once NPP has been obtained, users can calculate carbon uptake by multiplying NPP by the carbon content of the kelp.
Carbon content is obtained in the lab using an elemental analyser and may not be accessible for many projects. Fortunately, there is existing information about the carbon content of different kelp species available.
6.2.1.1 Elemental Composition
Users calculating the carbon content themselves should be aware that the content value changes in different parts of the kelp. For example, the carbon content of the stipe is typically lower than the blade. In addition, the carbon content can vary seasonally.
Calculating Elemental Composition
Collect representative samples of the kelp tissue you want to analyse, such as blades or stipes. Take multiple samples to account for variability within and among individuals (a minimum of three per site but up to 10).
Rinse the samples with fresh water to remove any debris, epiphytes, or salt. Pat samples dry with a clean towel or paper towel to remove excess water.
Dry the kelp samples in an oven at 60°C (140°F) until they reach a consistent weight. This process typically takes 24 to 48 hours, depending on the thickness of the samples. Drying removes moisture from the samples, which is essential for accurate carbon content measurement.
After the samples are completely dry, weigh them using an analytical balance to obtain their dry weight.
- Grind the dried samples into a fine powder using a grinder or mortar and pestle. This step ensures a uniform distribution of the kelp tissue and improves the accuracy of carbon content analysis.
- Use one of the below methods to determine the carbon content in the kelp samples:
a. Elemental analysis: In this method, a small amount of the homogenized sample is placed in an elemental analyser, which uses combustion to break down the sample into its constituent elements. The carbon content is then measured as a percentage of the total sample weight.
b. Combustion method: In this method, a known amount of the homogenized sample is combusted in a furnace at high temperatures (typically around 900-1000°C) in the presence of oxygen. The carbon in the sample is converted into carbon dioxide (CO2), which is then trapped and quantified using various techniques, such as gas chromatography or infrared absorption.
- Calculate the carbon content of the kelp samples based on the results of the chosen analysis method. This value is usually expressed as a percentage of the sample’s dry weight or as the mass of carbon per unit mass of the dry sample (e.g., mg C/g dry weight).
6.2.1.2 Proxies from the literature
Estimates of the carbon content of many kelp species are published in the literature and may be used in lieu of field measurements if the budget is limited (Table 17).
Table 17. Examples of carbon content estimates in kelp species.
| Genus | Carbon content | Region | Reference |
|---|---|---|---|
| Alaria | 31–32% | Alaska | Umanzor & Stephens, 2023 |
| Saccharina | 24–25% | Alaska | Umanzor & Stephens, 2023 |
| Ecklonia | 36% | Australia | Atkinson & Smith, 1983 |
| Laminaria | 29% | Scotland | Schiener et al., 2015 |
| Laminaria | 29% | California | Atkinson & Smith, 1983 |
| Nereocystis | 20–28% | British Columbia | Rosell & Srivastava, 1985 |
| Nereocystis | 24% | California | Atkinson & Smith, 1983 |
| Macrocystis | 29% | California | Atkinson & Smith, 1983 |
6.2.2 Projected Costs and Comparison of Methods
In addition to the cost estimates provided in the NPP section above (Section 6.1.3), the cost of determining carbon uptake includes the cost of sending samples to a laboratory for carbon content determination. This cost is variable, and it depends on the country, availability of laboratories with analytical carbon analysers, and the cost of chemicals for analyser calibration.
Each method of carbon measurement has pros and cons for implementation (Table 18).
Table 18. Pros and cons for carbon measurement options.
| Measurement Technique | Pros | Cons | Reference |
|---|---|---|---|
| Carbon Analysis with a Standard Elemental Analyser | Most accurate | Costly Not scalable | Umanzor & Stephens, 2023 |
| Carbon Analysis with a High-Temperature Drying Oven (Combustion Method) | Usually inexpensive and easy to do | Needs many replicates to obtain robust results | Bertsch & Ostinelli, 2019 |
| Proxies | Fast Cost-efficient Scalable | Not as accurate | Eger et al., 2023 |
6.3 Nutrient Uptake
Nutrient uptake refers to the amount of nutrients taken up from the water and transferred into biomass. It is reported in grams of nitrogen (N) and/or phosphorus (P) per unit time.
6.3.1 Measurement Options for Nutrient Uptake
The approach for calculating nitrogen or phosphorus uptake is the same as that of carbon described in Section 6.2, except that users must use the percent composition of these elements instead.
6.3.2 Basic Instructions
See instructions for measuring carbon uptake (Section 6.2.1).
6.3.3 Projected Costs and Comparison of Methods
As in the carbon uptake section (Section 6.1.3), nutrient uptake determination includes the costs estimates provided in the NPP section above in addition to the cost of determining nutrient uptake, which would include the cost of sending samples to a laboratory for N and P content determination. This cost is variable, and it depends on the country, availability of laboratories with analytical analysers, and cost of chemicals for analyser calibration.
Each method of nutrient uptake measurement has pros and cons for implementation (Table 19).
Table 19. Pros and cons for nutrient uptake measurement options.
| Measurement Technique | Pros | Cons | Reference |
|---|---|---|---|
| Nitrogen or Phosphorus Analysis with a Standard Elemental Analyser | Most accurate | Costly Not scalable | Umanzor & Stephens, 2023 |
| Proxies | Fast Cost-efficient Scalable | Not as accurate | Eger et al., 2023 |
6.4 PH Regulation
pH regulation is defined as the change in the pH value of surrounding seawater. This data is reported in difference of (delta) pH from one time point to the next.
6.4.1 Measurement Options for pH Regulation
The pH of the water is either measured with a probe or a chemical reaction kit. The former can be done in situ, while the latter requires a water sample collection and can be performed in the lab.
6.4.2 Basic Instructions
See water collection and measurement instructions in the nutrient levels section (Section 9.4.2).
6.4.3 Projected Costs and Comparison of Methods
Each method of pH measurement has various associated costs (Table 20), as well as pros and cons for implementation (Table 21).
Table 20. Projected costs for pH measurement options.
| Method | Cost |
|---|---|
| pH Strip | Low |
| In-Water | Medium |
| GIS Layer | Low |
| Lab Analysis | Low |
| Arrays or Sensors | Initial: Very High Ongoing: Medium |
Table 21. Pros and cons of pH measurement options.
| Measurement Technique | Pros | Cons | Reference |
|---|---|---|---|
| Water Samples: pH Strip | Very cost-effective Simple | Least accurate real-time measurement Location and day specific | Verhoeven, 2020 |
| In-Water Measure | Accurate if calibrated Precise location | Expensive equipment Fine calibration needed Location and day specific | Rérolle et al., 2012 |
| GIS Layers | Large spatial distribution Historic time series | Poor coverage Not specific to real-time conditions Not relevant for before-and-after comparisons Limited availability | Parker, 2016 |
| Water Samples: Lab Analysis | Very accurate Relatively affordable | Lab processing times Location and day specific | Robillard et al., n.d. |
| Arrays or Sensors | Time series data Accurate values | Restricted to sensor location pH effects are localized | Rérolle et al., 2012 |
6.5 Sediment Regulation
Sedimentation plays an important role in marine ecosystems and can stabilize or denude habitats. Sediments are transported by ocean currents and waves which themselves are modified by benthic features such as kelp forests. Depending on the situation increased sedimentation may be considered a service or disservice. Sediment regulation is reported in units of weight such as grams (g) or kilograms (kg).
6.5.1 Measurement Options for Sediment Regulation
Sedimentation is measured using sediment traps that are placed on the seafloor and left for a set time period.
6.5.2 Basic Instructions for Sediment Regulation
6.5.2.1 Sediment traps
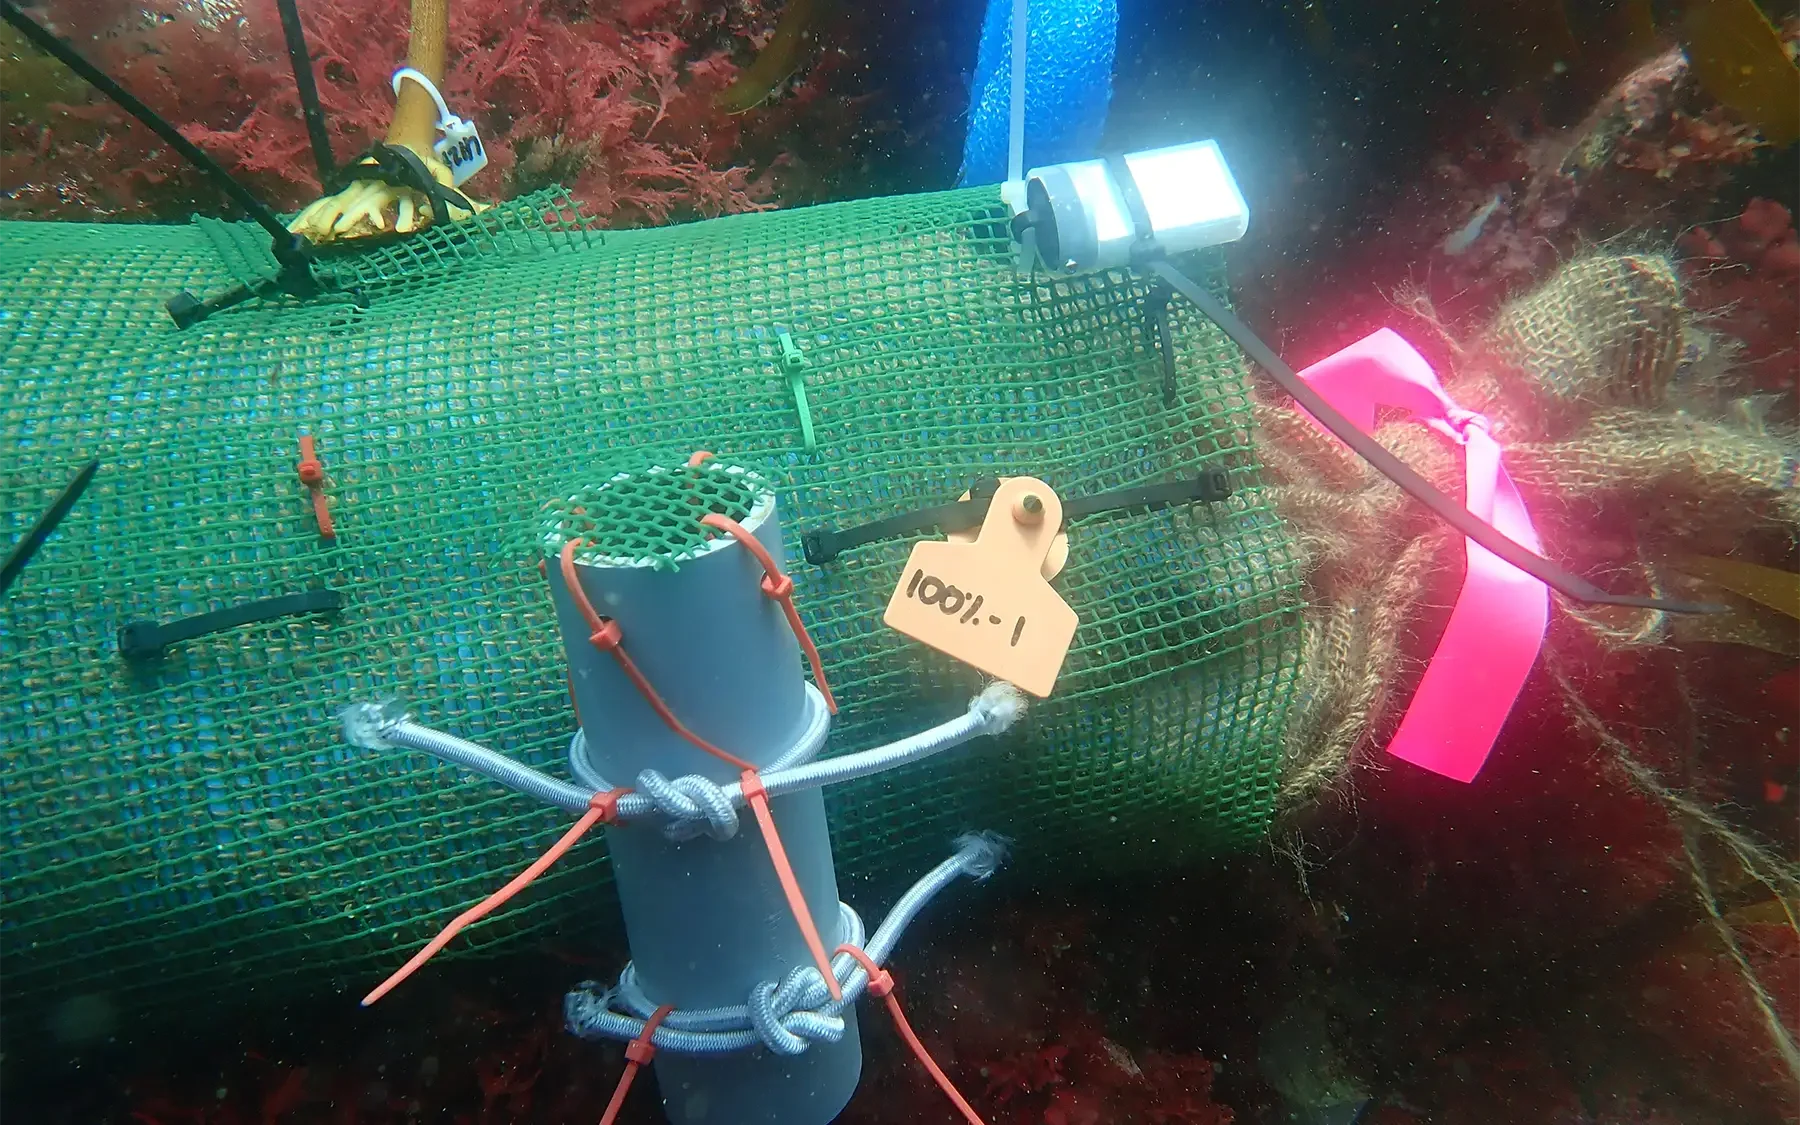
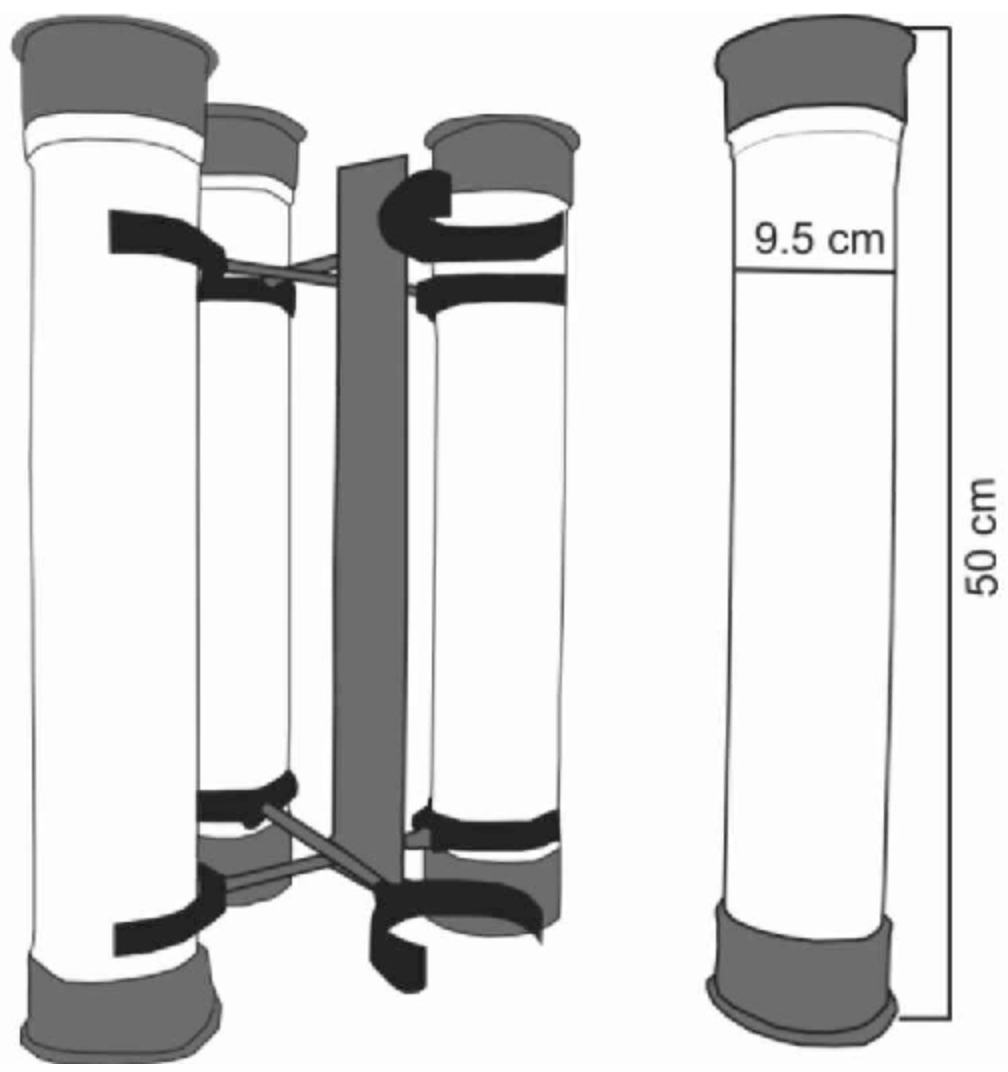
Sediment traps deployed within kelp forests are most commonly constructed of PVC piping with a height of between 30–60 cm and a diameter of 2.5–10 cm. The bottom end of the tube is sealed, and a mesh baffle is secured on the top end of the tube. Traps can be deployed at the sites by securing them to concrete stands, sandbags, or other weights (Figure 8). Depending on the sediment regime of the area, traps may need to be collected/emptied on a weekly, fortnightly, or monthly basis. To collect the sediment from within a trap, place the trap within a sealable plastic bag and transport it to the lab where the sediment can be flushed out and processed. Sediment should be dried in an oven at 60–70 °C until it reaches a consistent mass. This can then be used to estimate deposition rates, as well as being processed for particle size analysis and organic content.
*Figure 8. Example of a sediment trap attached to a sandbag in situ.*Assemble a unit like that depicted above (More details in Szmytkiewicz & Zalewska, 2014):
Lower it on the seafloor using a diver (or by hand on intertidal reefs).
Position the unit in a representative patch of reef.
Take a GPS point where you deployed the sediment trap.
Return at an appropriate time point to retrieve the trap, whether weekly, fortnightly, or monthly, depending on trap size and sediment regime. To retrieve the trap, place it in a sealable plastic bag and take it to the lab where the contents can be flushed out.
a. Even the best-designed traps may be lost due to storms and unusually high wave action.
Note that sediment traps may be a convenient location to attach data loggers, such as for temperature (Section 9.1.2).
6.5.3 Projected Costs
Sediment traps are rated as a medium cost.


