Table 4. Overview of metrics included in this guidebook.
| Kelp Characteristics | Regulating Services | Provisioning Services | Cultural Services | Biophysical and Stressors |
|---|---|---|---|---|
| Kelp Area | Primary Production | Harvested Kelp | Community Engagement | Temperature |
| Kelp Density | Carbon Uptake | Standing Stock Biomass | Science and Education | Salinity |
| Kelp Biomass | Nutrient Cycling | Secondary Production | Cultural Connection | pH |
| Percent Cover | pH Regulation | Biodiversity | Existence Value | Nutrient Levels |
| Sedimentation Rate | Recreational Visits | Herbivory | ||
| Person Hours | Disease and Fouling |
4.1 Habitat Mapping
The size (i.e., area) of a kelp forest ecosystem is a core metric when assessing the health of the ecosystem. The size is defined as the area within a polygon that wraps around the perimeter of a kelp forest. This metric is often used to indicate the scale of success for restoration projects or management approaches. Provided the project has density-based estimates (e.g., X value/m2) of the ecosystem services, the area of kelp forest can be used to estimate the total benefits provided by a restoration project or management approach.
4.1.1 Delineating a kelp forest
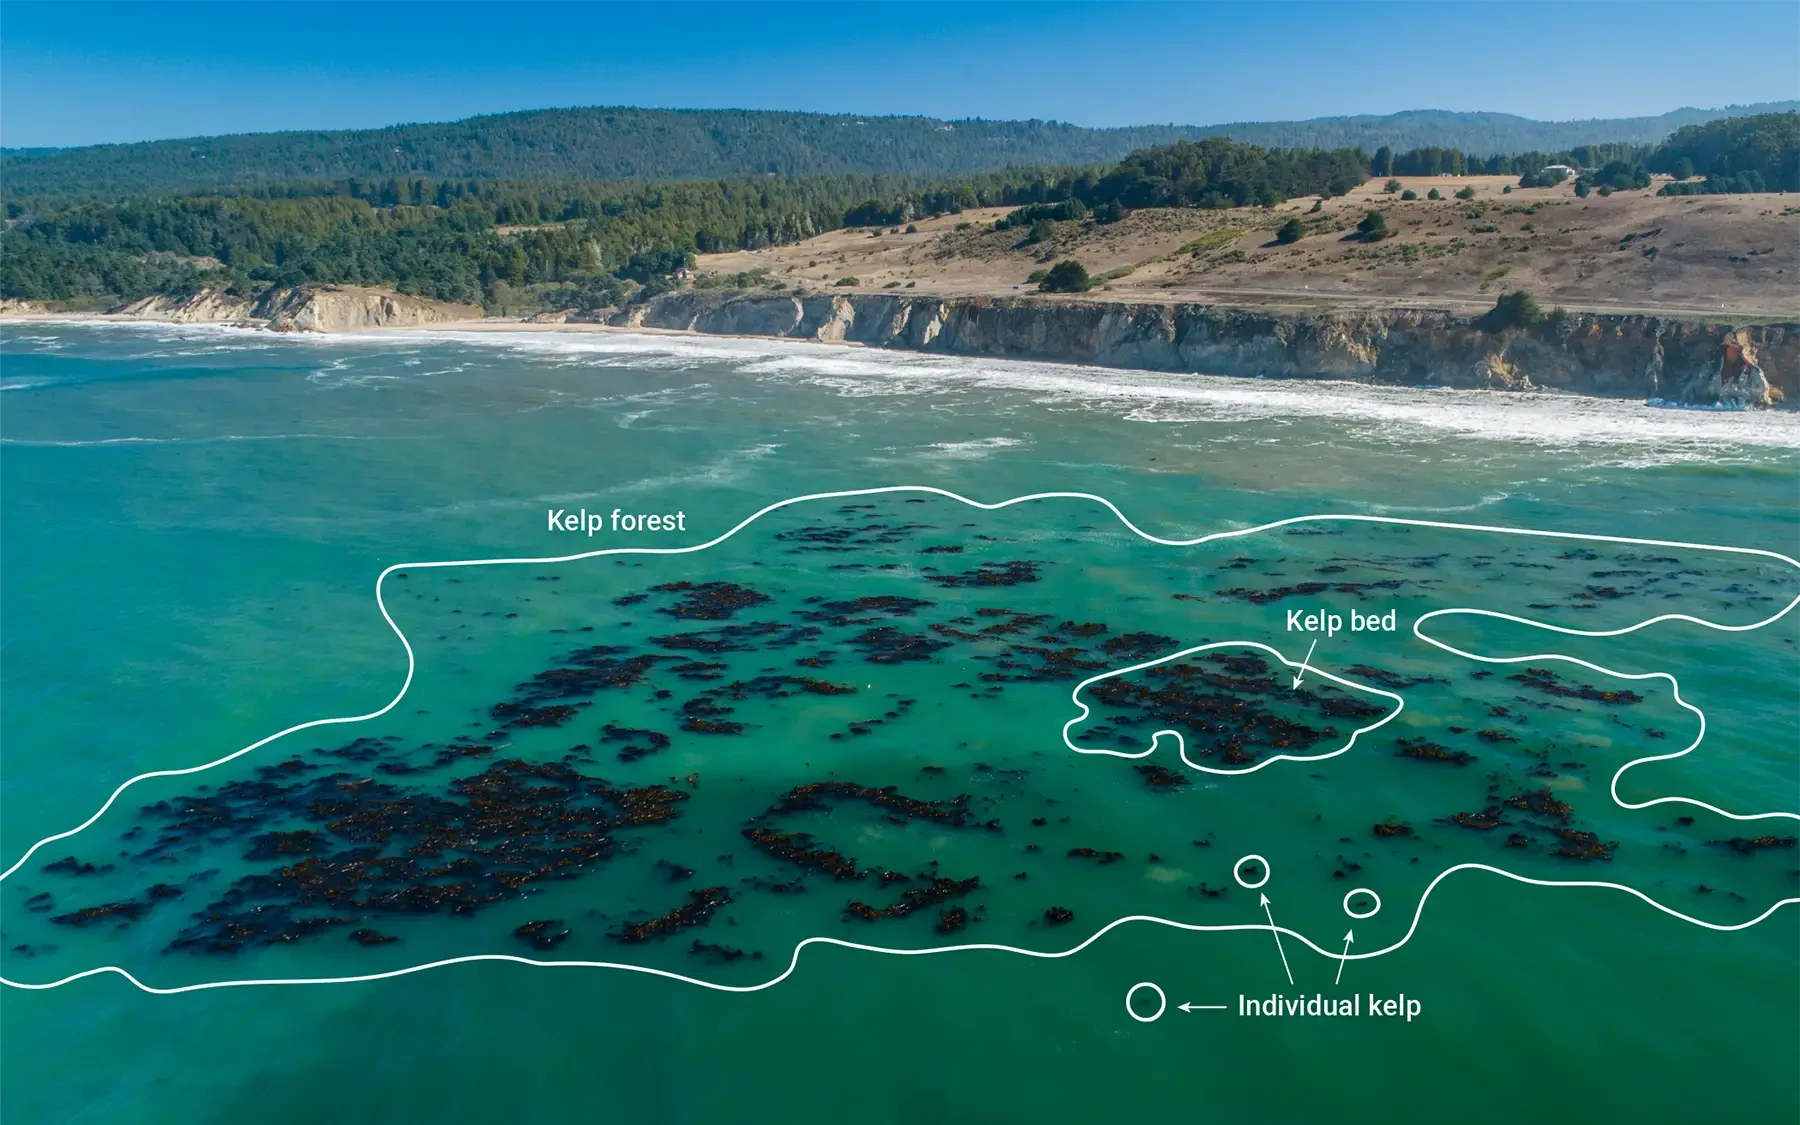
Determining the size of the kelp forest will depend on the scale of the project. This determination is further complicated by the fact that kelp forests are often patchy habitats and may have gaps in coverage but could still be considered a single unit. We recommend that projects create spatial units based on a single location (e.g., cove, beach, headland, point, bluff, etc.) and set a fixed distance, after which they consider a new unit of kelp forest to begin. For instance, if there is 10–50 m of bare rock habitat between aggregations of kelp, these two patches could be considered separate, and the bare rock area would not be included in the assessment. Conversely, if there was 2 m of non-kelp forest habitat between the patches, they could be considered functionally the same forest, and the small amount of bare rock is considered in the area assessment (Figure 3). While it is desirable to map the habitat while noting small scale gaps in canopy cover, this requires high resolution data, which may not be feasible or economical. Therefore, projects may need to make coarser assessments of kelp habitat areas which ignore such small gaps in canopy cover (10–50 m).
Figure 3. Illustration of patch dynamics and kelp bed boundaries in kelp forest ecosystems
You can determine the area of a kelp forest by charting the perimeter and using spatial mapping software or simple geometry to calculate the size of the restored kelp forest. There are several ways to chart the perimeter of the kelp forest, which we will discuss next.
4.1.2 Reporting Units
We recommend reporting the area of a kelp forest using the International System of Units (SI) such as m2, ha, or km2.
4.1.3 Measurement options
The four options for mapping the area of a kelp forest are:
In-water
On-water
Aerial
On foot (intertidal only, not covered in this document)
4.1.3.1 In-Water
Mapping the perimeter of a kelp forest in water provides the greatest accuracy and may be required for subtidal habitats that are too deep to map using aerial imagery. Conversely, mapping kelp forests in water is limited by the scale that can be covered, either by a boat or a swimmer.
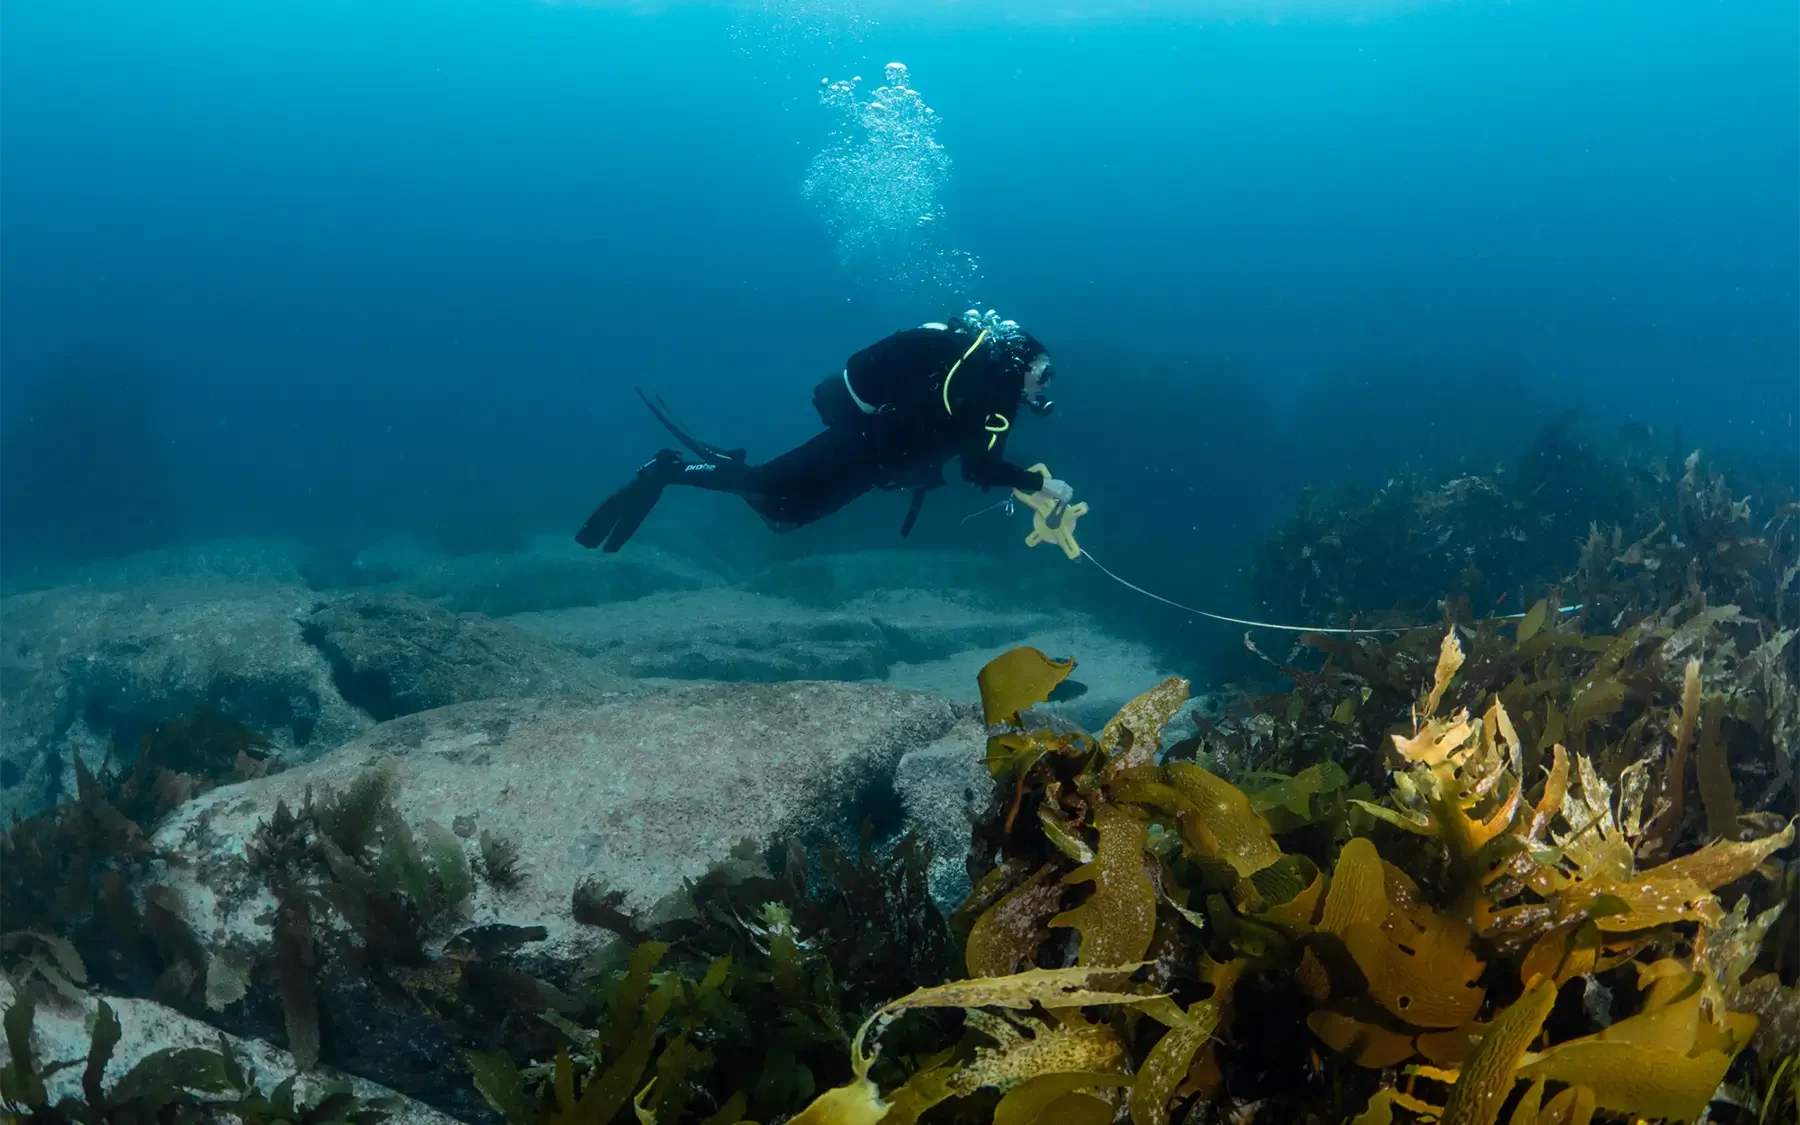
In-water mapping is done by a snorkeler, SCUBA diver, AUV, or towed underwater vehicle. Snorkelers may also use GPS points to map the perimeter while SCUBA divers rely on surveying methods as GPS typically does not work underwater (See Section 11.0 for new technologies). Autonomous and towed video cameras may also be used so long as they are georeferenced on the surface.
4.1.3.2 On-Water
On-water methods include using powered or unpowered watercraft to navigate around the edges of the kelp forest while charting perimeter points, either using a GPS or survey equipment.
4.1.3.3 Aerial Surveys
Aerial surveys may be completed using satellites, low altitude aerial imagery, drone surveys, or Light Detection and Ranging (LiDAR). These approaches are more expensive (save freely available satellite data) but can cover the greatest area. They may however be restricted by depth and are best suited for surface canopy forming kelp species (e.g., Macrocystis).
4.1.4 Basic Instructions for Habitat Mapping
4.1.4.1 Aerial Imagery
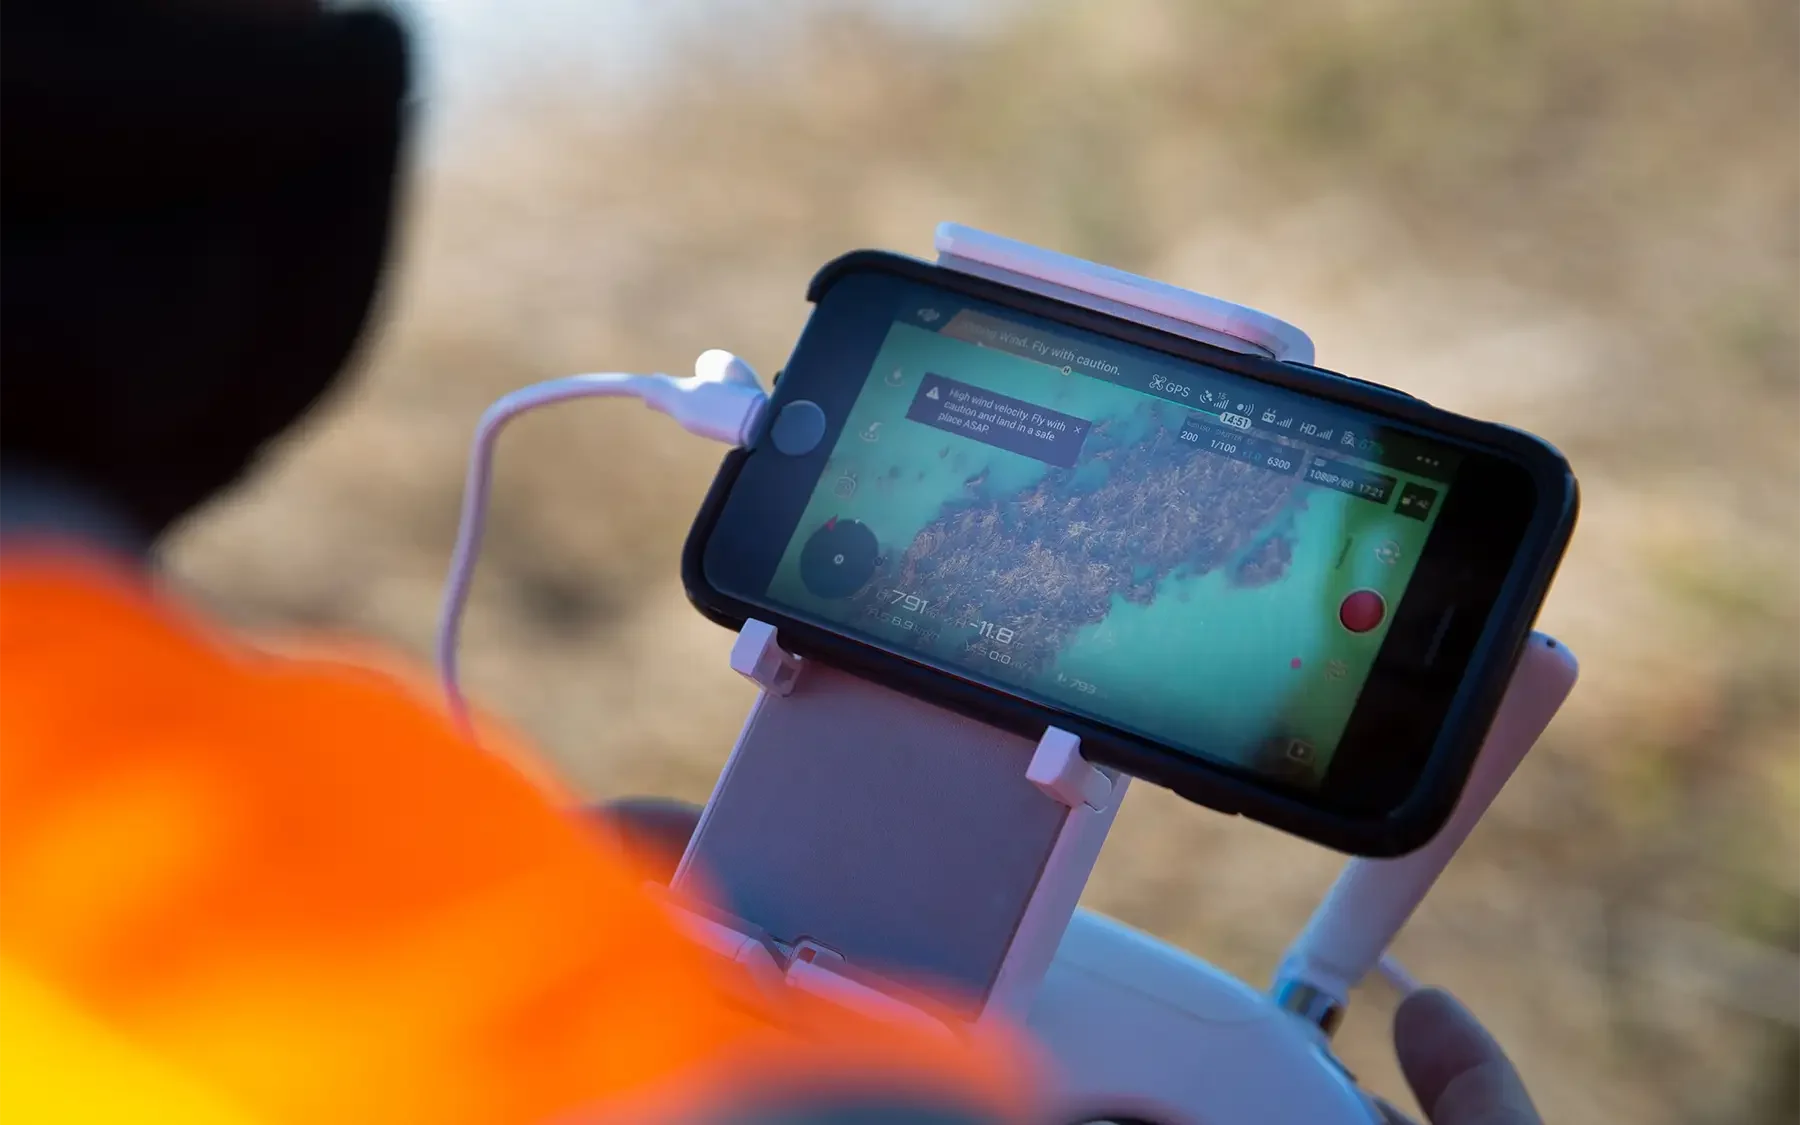
A comprehensive overview of mapping canopy forming kelp can be found here. Aerial imagery can be obtained from satellites, via LiDAR and low flying aircraft, and drones. LiDAR and low flying aircraft data usually must be contracted and is therefore expensive. Drone data must be manually collected but provides the opportunity to collect high resolution data with a much lower cost than low flying aircraft.
To obtain aerial imagery from satellites, consult popular databases with freely available information such as LANDSAT or Copernicus. Higher resolution, paid imagery is also available (e.g., Planet Labs). Always make sure to check the date of the imagery as well as its resolution (e.g., LANDSAT 8 had a resolution of 15–30 m).
Estimating kelp forest area using aerial imagery requires knowledge and expertise in geoinformation software (e.g., ArcGIS, QGIS, etc.). Due to the complexities involved, this guidebook does not provide specific information on this process. However, in short, there are two options: manual classification and automated or supervised classifications.
Manual Classification:
Import aerial imagery.
Georeference images with appropriate datum.
Manually create a polygon around the space that you believe is a kelp forest.
Calculate the area of that polygon.
Automated or Supervised Classifications:
Import aerial imagery.
Georeference images with appropriate datum.
Start the classification process by selecting training points that you know to be kelp forest.
Run the remote sensing software to make predictions about kelp forest on unclassified images.
Calculate the area of the cells that are classified as kelp forest.
We note that you may also run unsupervised classifications, but this is not recommended as it produces more errors.
If you are a smaller project with a limited area to measure, it is easier to manually classify kelp cover. If you are a larger project, it is more time efficient to train yourself or your team to run the automated classification process.
Further details on how to do the automated classification may be found here.
4.1.4.2 In-Water Surveys
While in-water surveys may be required to map subtidal kelp forests, this approach can only be applied over smaller kelp forests of less than 1–2 ha in a single dive. Larger forests will require multiple dives.
Steps for a SCUBA In-Water Survey:
Locate the edge of the kelp forest.
Record the compass direction in which the edge of the kelp forest continues.
Mark a starting dot on a piece of waterproof paper or underwater slate along with the first declination (compass direction).
Place the weighted end of the transect tape at the starting point.
Swim the edge of the kelp forest, letting out the measuring tape.
Continue swimming until the edge of the forest deviates noticeably (more than 30° for 10 m).
Once the edge deviates, stop swimming, mark a new dot, and record the distance measured between the last two points on the paper/slate.
Gently reel in the transect tape, taking care not to harm benthic life as you do so.
If the measuring tape runs out before a change in direction is noted, note the distance elapsed, reel in the tape, and then follow step seven in the same direction.
Take a new declination and repeat the process.
Once complete, calculate the area of the polygon that you have charted. The area may be calculated by using geometric calculates (e.g., area of triangle, rectangle, etc.) or by importing the image into a GIS software and georeferencing the polygon and calculating the shape.
Steps for In-Water Survey with Drop Cameras:
The core principle is to move along the perimeter of the kelp forest or map a grid, dropping the camera to the depth of the kelp forest and determining where the edge of the forest is. These points are then mapped with a GPS at the surface. Most drop cameras require an external power source, so projects will be limited to using powered watercraft with a power source. These cameras also require adequate visibility (greater than 3 m) to identify the edge of a kelp forest.
Identify the broader area around the kelp forest or kelp forest patch you intend to monitor. This should encompass the entire forest and some surrounding areas for context. The two steps involved are perimeter mapping and measurement grid creation. We discuss both below.
Map the Perimeter
Find the perimeter edge of the kelp forest or kelp forest patch you intend to monitor. Use your GPS to map the perimeter. Waterproof cases and floats are advisable for any GPS units used around water.
If your GPS has an accurate tracking function, enable it at your first monitoring point and disable it when you have traversed the length of the perimeter. If not, go to Step 3 below.
If your GPS has no tracking function, use your GPS to drop the first pinpoint. Ensure the GPS is calibrated to the highest accuracy possible. This process may require waiting for the device to lock onto the correct number of satellites. Follow the perimeter edge of the kelp forest.
a. Slowly motor with the camera on, feeding live video.
b. Assuming you are following a continuous line of kelp forest, create a new GPS point every 20–50 m.
c. Stop once you have found a break in the kelp forest.
d. Place a GPS point.
e. Assess the next direction to follow and repeat the above steps until you have completed the polygon.
Once you have returned to your starting pin, note the titles of the pins. Titles are often sequential numbers: for instance, 113–246. Alternatively, if your GPS allows you to create polygons, close the loop and create the polygon.
Import the pins into a geographic information system (GIS) software.
Select the pins related to a single kelp bed and convert them into a polygon.
Calculate the area of that polygon.
Creating a Measurement Grid
Create a Grid Overlay on the Area
a. Using GIS software or physical map, overlay a grid on the mapped area. The size of the grid squares should be based on the size of the kelp forest and the resolution needed.
b. Each square in the grid represents an individual area to be monitored with the camera.
Map the Grid
a. Start at the first grid square, using your GPS to navigate accurately.
b. Slowly move over the grid square with the camera on, capturing live video or taking photographs.
c. Record the benthic substrate at the centre of the grid cell. Take GPS coordinates at each corner of the grid square or at regular intervals within the square for more detailed mapping.
Move to Subsequent Grid Squares
a. Proceed to the next grid square following a logical sequence (e.g., row-by-row or column-by-column) to ensure complete coverage.
b. Repeat the camera recording process for each grid square.
Marking Incomplete or Unclear Areas
a. If any areas within a grid square are not clearly visible or mapped due to underwater conditions, mark these as incomplete in your records for potential re-examination.
Complete the Grid Mapping
a. Continue the process until every grid square covering the kelp forest and surrounding area has been mapped.
Data Compilation and Analysis
a. Import GPS data and camera footage into GIS software.
b. Use the software to stitch together the camera footage or images from each grid square, creating a comprehensive map of the kelp forest.
c. Analyse the compiled data to assess the health, density, and spread of the kelp forest.
Area Calculation and Reporting
a. Calculate the total area covered by the kelp forest within the grid.
b. Generate a report summarizing the findings, including any notable features or changes in the kelp forest.
Steps for In-Water Survey using AUVs/ROVs:
Using automated or remote underwater vehicles (AUV and ROV, respectively) to map kelp forests is most appropriate for deep water species and projects with substantial budgets. Operating these vehicles requires considerable technical expertise outside the scope of this guide. However, AUVs/ROVs are now publicly available for less than $10,000 USD. As costs decrease and the body of knowledge about operations and output processing increases, AUVs/ROVs may become increasingly useful tools for mapping subtidal kelp species. If the project is operating for many years and there will be repeated surveys, the initial investment, although high, may prove worthwhile.
It may still be necessary for them to have a link to the surface to mark GPS points. Some newer models may have the ability to measure distances, but they will not be georeferenced. In this case the user would get the area (e.g., m2) but not the polygon on the map.
4.1.4.3 On-Water Surveys
For safer operations, we recommend working in teams of at least two people.
Steps for On-Water Survey using Boats
Secure a powered or unpowered watercraft.
a. Unpowered watercraft may be desirable for systems with high surface canopy cover that can ensnare boat motors. Kayaks, paddleboards, or canoes are good for this process over small scales. Larger scale monitoring will require a powerboat.
b. You may also snorkel from the surface to get a better view of the subtidal kelp. If you choose this option, ensure your GPS is waterproof, in a waterproof case, and attached to a float and a line to ensure that it is not lost to the ocean.
Find the perimeter edge of the kelp forest or kelp forest patch you intend to monitor.
a. Use your GPS to drop the first pinpoint.
i. Ensure the GPS is calibrated to the highest accuracy possible. This process may require waiting for the device to lock onto the correct number of satellites.
ii. Follow the perimeter edge of the kelp forest, dropping a GPS pin every 10–20 m.
iii. Once you have returned to your starting pin, note the titles of the pins. Titles are often sequential numbers, for instance, 113–246. Alternatively, if your GPS allows you to create polygons, close the loop and create the polygon.
iv. Import the pins into a GIS software.
v. Select the pins related to a single kelp bed and convert them into a polygon.
vi. Calculate the area of that polygon.
b. Use the GPS tracking function and ensure that you turn it off once you have completed the parameter of the kelp forest.
4.1.5 Projected Costs and comparison of methods
Each method of habitat mapping has various associated costs (Table 5), as well as pros and cons for implementation (Table 6).
Table 5. Projected costs for habitat mapping methods.
| Method | Cost |
|---|---|
| Aerial: Drone Contractor | Medium |
| Aerial: Drone Images In-House | Low |
| Aerial: Existing Imagery | Low |
| On-Water: Drop Camera | Low |
| On-Water: GPS Point | Medium |
| In-Water: SCUBA | High |
Table 6. Pros and cons for kelp forest mapping options.
| Measurement Technique | Pros | Cons | Reference |
|---|---|---|---|
| Aerial Imagery (Drone, Satellite, Plane) | Covers large areas | Cannot detect deep water kelp Potentially low spatial resolution No associated biodiversity or kelp density data High expertise required to process | Moro-Sota et al., 2020 |
| In-Water Surveys (Snorkel) | Highly accurate Depending on visibility, may see subtidal kelp Can obtain biodiversity and density data. Less training required to process | Covers a small area Slower than aerial or boat-based surveys Only possible for shallow kelp in good visibility | Edgar & Stuart-Smith, 2014 |
| SCUBA | Highly accurate Accesses subtidal kelp | Covers a very small area Even slower than snorkel surveys Requires diving qualifications | Anderson et al., 2007 |
| Autonomous Underwater Vehicles (AUVs) and Underwater Videos (towed) | Covers significant area Can obtain biodiversity and density data | High processing time Expensive | Marzinelli et al., 2015 |
| On-Water Visual Surveys (Watercraft) | Covers more area than snorkel or scuba diver May be cost-effective if using non-powered vessels (e.g., kayaks) | Powered vessels may become tangled in surface canopy kelp Powered vessels have higher operating costs | Berry et al., 2019 |
4.2 Kelp Forests
The density of a kelp forest may be used as a proxy for the health or condition of that ecosystem. Density is defined as the number of juvenile or adult kelp stipes per unit of area, most typically measured in m2. When comparing within species, higher density kelp forests are more productive, support higher biodiversity, and generally provide greater ecosystem services than lower ones. Measurement reporting units for density are number per unit of area (e.g., cm2, m2, ha, km2). Juvenile kelp may be measured using cm2, but we suggest m2 for measuring the density of adult kelp.
4.2.1 Measurement Options
Unless you are measuring intertidal kelp forests at low tide, in-water survey methods are required to obtain measurements of density. As such, it is generally more expensive and laborious to measure the density of a kelp forest compared to the area. Measurement options for density include:
- Diver Visual Surveys
- Transect and Quadrats
- Diver Photography Surveys
- Drop Cameras
- Autonomous Underwater Vehicles
- Towed Underwater Videos
4.2.1.1 Diver Visual Surveys
Divers may manually count the density of a kelp forest during underwater visual surveys. Quadrats and transects are the suggested approach (Figure 4). The basic setup for this approach is to run parallel lines known as transects across the kelp bed and repeatedly stop at set distances, lay down a square of a set size called a quadrat, and count the number of kelp in that quadrat. The number of transects, the length of transects, the number of quadrats, and the distance between the transects and the quadrats can vary and may be set by the user. These may be adjusted depending on the size of the kelp forest and the time available underwater.
4.2.1.2 Transect and Quadrats
There is no definitive answer to how many transects and quadrats should be used to measure a project. Patchy, newly grown, or restored kelp forests may require more transects and quadrats due to their high variability. Projects may adapt the below approach to their own needs.
We suggest eight 50 m transects, 2 m in width, with eight evenly spaced quadrats along each transect. If eight is too intensive, we suggest a minimum of four. Quadrats typically measure between 0.1 m and 2 m long and wide. A larger quadrat captures a more representative area but is more difficult to manage underwater and may become caught or entangled. Additional transects and quadrats may be used if time and resources allow. Additional surveys will typically reduce sampling bias and minimize the variance of the values reported.
The number of holdfasts with a stipe or stipes (some holdfasts are fused) are then recorded on waterproof paper attached to a clipboard.
4.2.1.3 Diver Photography Surveys
Users may photograph quadrats if there is not sufficient time to count the holdfasts in the water, or they do not have underwater paper or slates to record information. This approach is only possible if holdfasts are visible with the diver floating over top of the quadrat, however often, kelp blades will prevent users from clearly photographing the quadrat from directly above. Users may overcome this issue if there is sufficient water movement that pushes the blades momentarily to the side or if the blades may be moved manually. It is important to ensure that all holdfasts within the quadrat can be seen clearly in each image otherwise it is not possible to estimate kelp density from the photographs. If you cannot get a clear picture, do not attempt to use this method.
4.2.1.4 Drop Cameras
It is currently unlikely that restoration will take place at depths where drop cameras are required. Drop cameras equipped to measure density are most appropriate for deep water species and projects with substantial budgets; however, operating drop cameras requires considerable technical expertise outside the scope of this guidebook.
4.2.1.5 Autonomous Underwater Vehicles (AUVs)
New technologies are rapidly making underwater drones with high resolution video and photography capabilities available at lower and lower costs. Using AUVs means that divers do not have to get in the water and oftentimes, they can be deployed from shore. There is a significant upfront cost in buying an AUV – from thousands to tens of thousands of dollars – but the monitoring costs are significantly reduced on each site visit. Users should run the AUV in the same pattern as video or diver surveys, though they may wish to expand the area covered, as the AUV often has more bottom time than diver.
4.2.1.6 Towed Underwater Videos
Towed underwater video surveys are less technologically complex than AUVs but require a boat to pull the video apparatus through the water. This trade-off entails lower costs to purchase the equipment but more restrictions in how they can be operated. For example, AUVs can operate in shallower waters, and use a more consistent speed than a boat. Users can still use towed videos to capture a larger area than with SCUBA or visual surveys.
4.2.2 Basic Instructions for Measuring Kelp Density
4.2.2.1 Diver Visual Surveys
See the instructions for biodiversity surveys (Section 5.1).
4.2.2.2 Diver Photo/Video Surveys
See the instructions for biodiversity surveys (Section 5.1).
4.2.2.3 Autonomous Underwater Surveys
The instructions for this method will vary depending on the AUV used. However, in short, they should follow the same principles as the diver video surveys detailed in Section 5.1.2.2 though the length of the transect may be extended to reflect the range of the AUV.
4.2.3 Projected Costs and comparison of methods
Each method of density measurement has various associated costs (Table 7), as well as pros and cons for implementation (Table 8).
Table 7. Projected costs for kelp density measurement options.
| Method | Cost |
|---|---|
| Diver Visual Surveys | Low |
| Diver Photo/Video Surveys | Medium |
| Autonomous Underwater Surveys | Very High |
| Towed Video Surveys | Very High |
| Drop Cameras | Very High |
Table 8. Pros and cons of kelp density measurement options.
| Measurement Technique | Pros | Cons | Reference |
|---|---|---|---|
| Diver Visual Surveys | Low tech Instant data High accuracy | Requires divers Time intensive Limited coverage | Edgar & Stuart-Smith, 2014 |
| Diver Photo/Video Surveys | Does not require in-water counting Less time in the water | Data processing time Potentially less accurate than visual surveys | Smith et al., 2021 |
| Autonomous Underwater Surveys | Cover larger areas Costs are dropping | Expensive Still have limited coverage Data processing | Bewley et al., 2012 |
| Towed Video Surveys | Cover largest areas | Tech and equipment intensive Data processing time | Marzinelli et al., 2015 |
| Drop Cameras | Can reach very deep kelp | Very small sample area Expensive Data processing time Unlikely to be needed for most restoration projects | Caselle et al., 2018 |
4.3 Measuring Biomass of Kelp Forests
Biomass is defined as the wet or dry weight of kelp in a defined area. Units of biomass are reported as weight per unit of area. We suggest reporting weights in grams (g) and area in m2, but alternatives are kilograms (kg), tonnes (t), hectares (ha), and square kilometres (km2).
4.3.1 Measurement Options
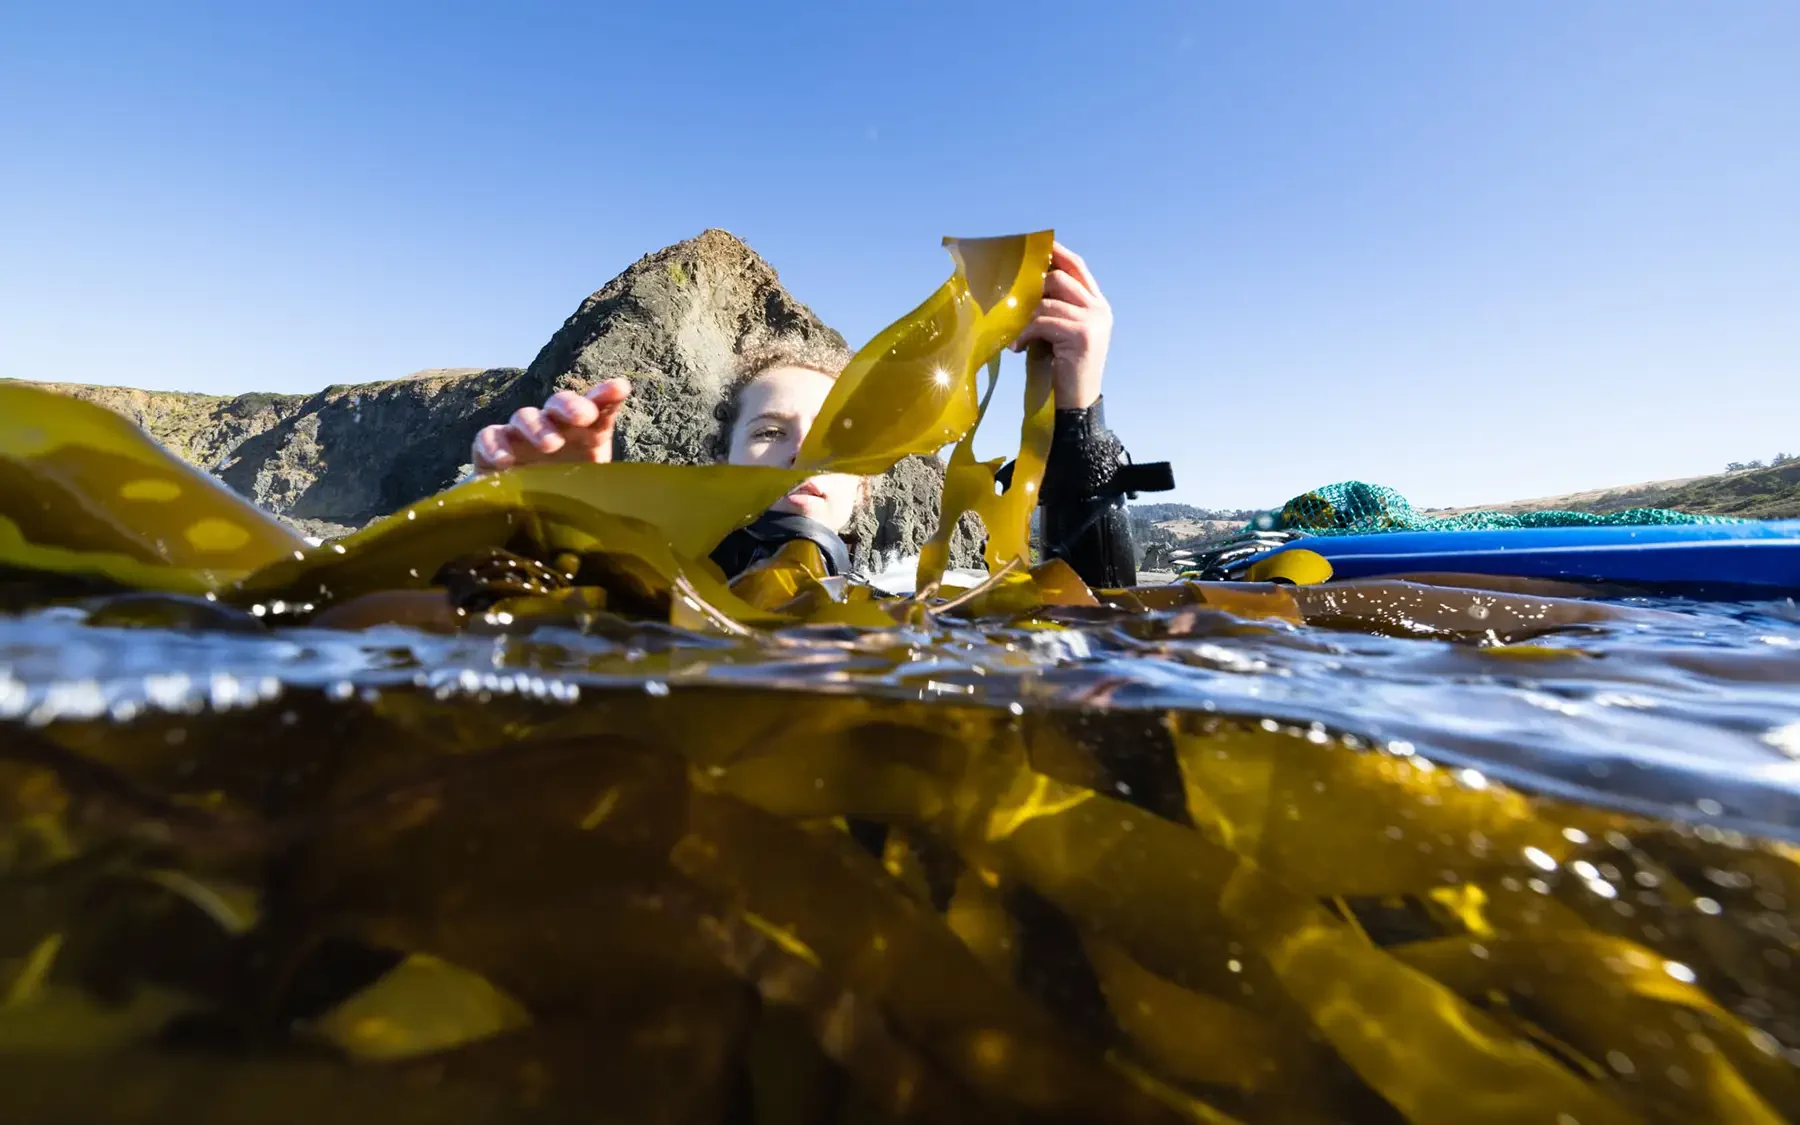
Biomass is most accurately measured by removing kelp from the water and weighing it on the surface, on land, or in the lab. Biomass measurements should be paired with density measurements so that fewer kelp individuals are removed. We suggest that users remove 10–30 kelp individuals depending on the size variation at their site. If individuals are similar in size, fewer collections are needed, but if there is substantial variation in the size of kelp individuals, users will need to collect more individuals to get a representative sample. Whenever possible, the number of kelps removed from the water should be minimized.
If users do not need exact values, or do not want to/cannot remove individual kelps, they may use established allometry relationships that relate the dimensions of a kelp plant (e.g., height, width, etc.) to its weight (see Section 4.3.2.2).
Users can collect the kelp after they count density or do it on separate dives.
4.3.1.1 Transect-Quadrat
For biomass measurement, we recommend the transect-quadrat method with, ideally, eight 50 m long transects. The number of quadrats will vary depending on how many kelps are being removed. Simply divide the total number of kelps you would like to collect by four to determine how many kelps you should remove per transect. For example, if you have 20 kelps collected in a transect, divide the number 20 by four and remove five kelps for that transect. Next, divide the length of the transect by the number of kelps per transect to get the spacing of the collections. For example, for a 50 m long transect and five kelps removed, that is one collection every 10 m.
Alternatively, you may haphazardly sample a consistent (homogeneous) kelp forest by swimming and selecting individuals at random.
Once a sample is collected from a quadrat, it may be sent straight to the surface or kept with the diver using a mesh bag. Because kelp is generally quite voluminous, we suggest that users minimize the amount of kelp material they carry with them while diving. Samples may be returned to the surface using lift bags, surface lines, or by being passed off to a free diver if available.
Transects should run across a section of the reef with consistent characteristics, for example the slope and depth.
Once users have collected the kelp, they can obtain either its wet weight or dry weight. Wet weights are obtained by removing excess water and fouling organisms (e.g., other algae, bryozoans) and then placing the kelp on a scale. You may wish to use a simple spring scale as they are durable; the precision required does not necessarily require an electronic scale. Dry weight measurement is necessary for true productivity calculations, but requires putting the kelp in a drying oven, typically for 12–24 hours, but perhaps longer if required.
Users may obtain estimates of dry weights by using previously published ratios between wet weights and dry weights.
4.3.1.2 Echograms
Echograms can estimate the biomass of kelp forests. They are sonar or acoustics monitoring tools that use sound waves to record measurements and ultimately create displays of marine habitat features. Emerging research suggests that using echograms achieves an accuracy of 67% to 74%, which may be sufficient for some monitoring programs (1; 2; 3).
4.3.1.3 Measuring Biomass with Allometry Relationships
Allometry allows users to get non-destructive estimates of biomass. Users can either create these relationships themselves or rely on published works. These relationships rely on correlations between length, width, and weight – in other words, allometric relationships between body size and shape of an organism. While the statistics of these relationships is beyond the scope of this document, a suite of statistical methods is available including linear models (4), regression trees (5), and Generalized Additive Models (6). Each can be used to create formulas or predictions for weight based on physical parameters. The programming language R is a popular, open-source program to run these analyses.
4.3.1.4 Light Attenuation (Intertidal Only)
There is now a method for determining kelp biomass using light attenuation. This work is only validated for intertidal species – namely, Fucus – but may prove useful as a low-cost, non-destructive sampling method in those ecosystems. See Johnson (2022) for further details.
4.3.2 Basic Instructions for Biomass Measurement
4.3.2.1 Transect-Quadrat with Kelp Collection
Decide if you are processing the sample in the field or the lab. Field measurements will be simple and more time-efficient but will not be as accurate as lab measurements. Your choice of sample or field processing also depends on whether you are measuring wet or dry weights. If you are only measuring wet weights, then field measurements may be most appropriate.
- Determine how many kelps you would need to remove. We suggest 10 to 30 per site.
- Divide the length of the transect by the number of kelps required to get the number of kelp samples per transect.
- Randomly select quadrats from the density measurements.
- Remove a random kelp individual from each quadrat.
- Pat dry and remove any fouling organisms.
- Measure the wet weight of each individual.
- (Optional) Place the individuals in a drying oven to determine the dry weight.
- Multiply the average weight of a kelp by the number of kelps per m2 to get biomass per m2.
4.3.2.2 Allometry
When length-to-biomass ratios are available, calculate allometry as follows:
- Determine how many kelps you would like to measure. We suggest 10 to 30 per site.
- Divide the length of the transect by the number of kelps to get the number of kelps per transect.
- Divide the length of the transect by the number of kelps per transect to get the quadrat spacing.
- Follow the steps for running transects and quadrats as outlined in Section 3.0.
- Measure the stipe length and lamina (blade) length of a random kelp individual from each quadrat.
- Convert these values into biomass using previously published ratios.
Allometry instructions when creating your own length-to-biomass relationships:
- Follow the kelp collection instructions (Steps 1–6).
- Run regression models of kelp weight versus stipe length, stipe circumference, and blade length.
4.3.2.3 Sonar
Deploying a vehicle to collect sonar data as well as interpreting the sonar data is a moderately complex process and requires a level of expertise not possessed by the average marine ecologist. Therefore, the steps for this method are not outlined here but discussed by Kartveit et al. (2022).
4.3.3 Projected Costs and comparison of methods
Each method of biomass measurement has various associated costs (Table 9), as well as pros and cons for implementation (Table 10).
Table 9. Projected costs for kelp biomass measurement options.
| Method | Cost |
|---|---|
| In-Water: SCUBA Allometry | High |
| In-Water: SCUBA Collection | High |
| Sonar | Unavailable |
Table 10. Pros and cons for kelp biomass measurement options.
| Measurement Technique | Pros | Cons | Reference |
|---|---|---|---|
| Direct Collection | Most accurate | Destructive | Kelp Ecosystem Ecology Network, 2024 |
| Allometry Relationships | Less time and resource-intensive Non-destructive | Less accurate Statistical experience needed if developing your own proxies | Kim et al., 2017 |
| Sonar | Scalable to large areas More cost-efficient than divers | Less accurate Often requires proprietary software | Kartveit et al., 2022 |
4.4 Cover of Kelp
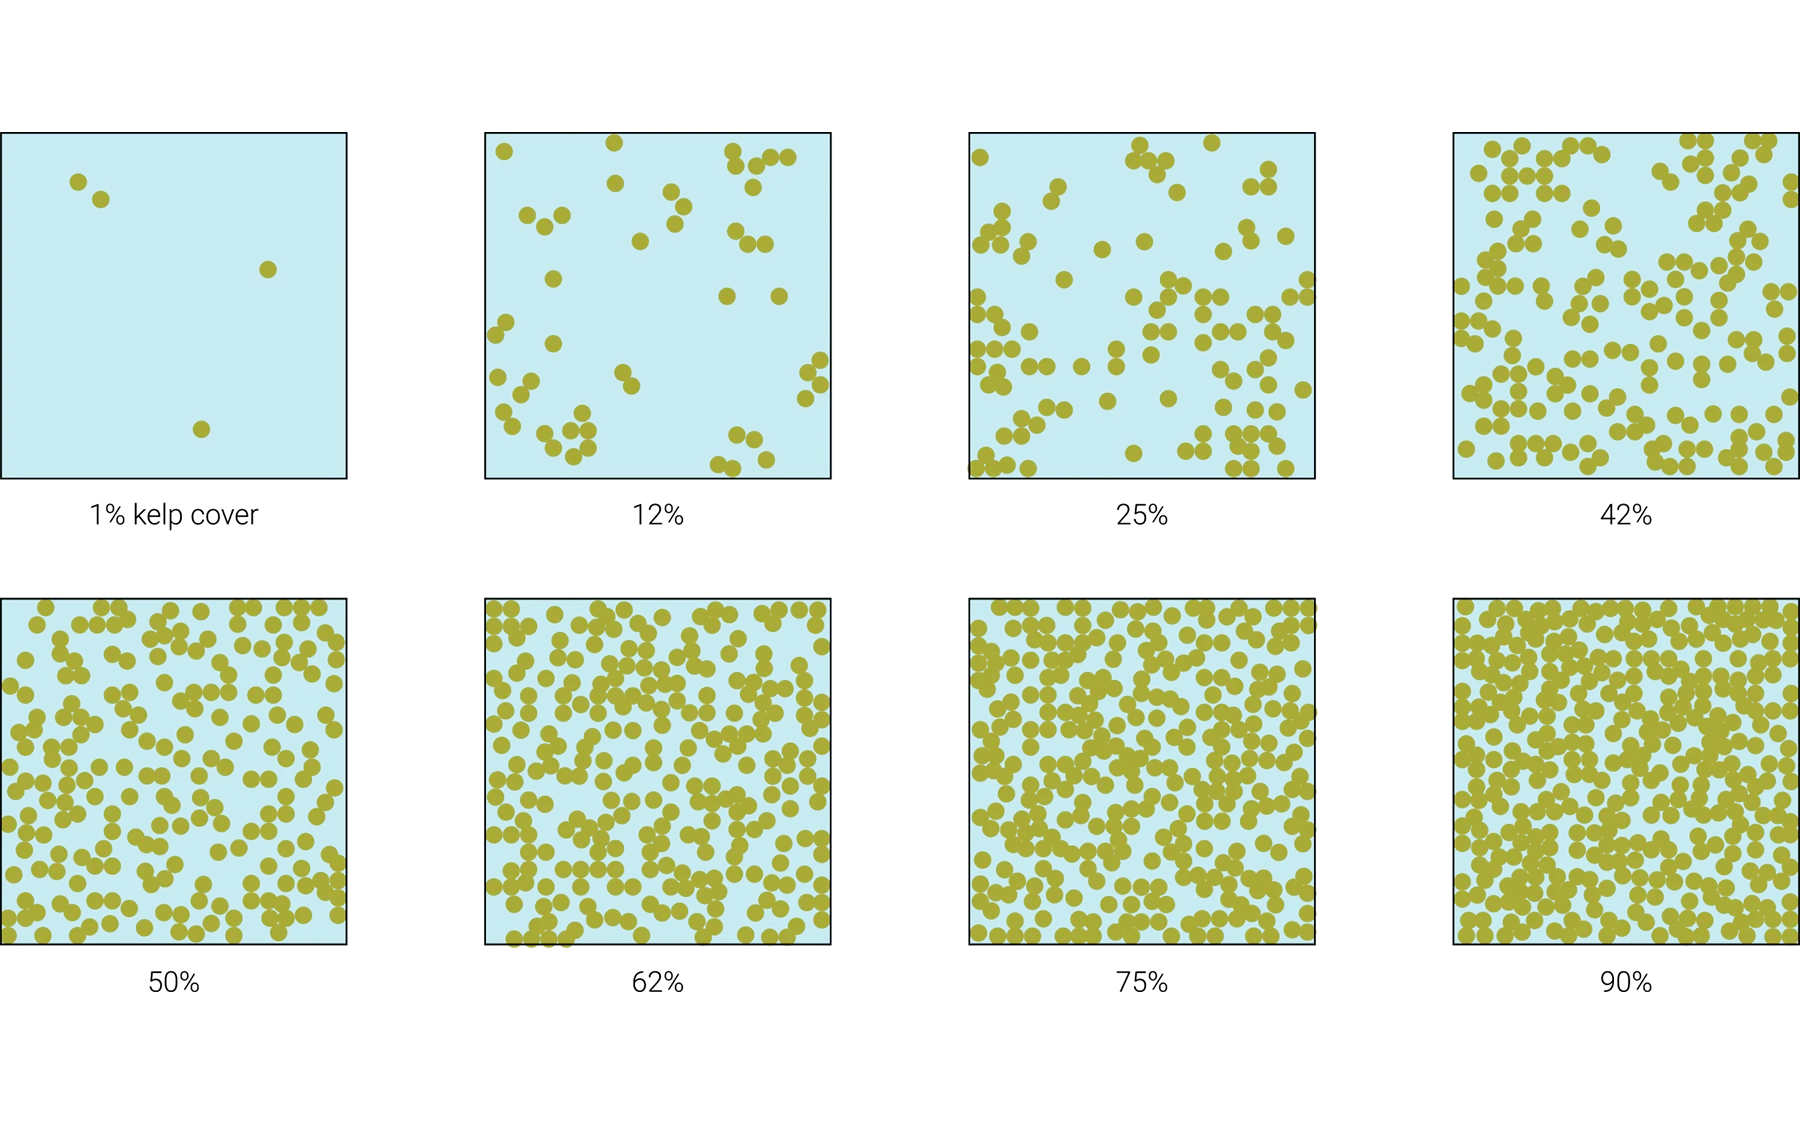
Kelp’s percent cover is defined as the percentage of the seafloor that is covered by kelp forest (Figure 5). In a conservation context, this area should be restricted to potential kelp habitat (i.e., rocky reef, suitable depth) and should not include non-suitable habitat (e.g., sand). Percent cover may also be used as a measure of kelp forest condition or health. Percent cover is reported in percentage (%).
Figure 5. Visual guide for estimating percent cover of kelp forest ecosystems.
4.4.1 Measurement Options
Divers or snorkelers may visually estimate percent cover using the transect and quadrat methods, or via unified point contact (UPC).
4.4.1.1 Transect and Quadrat
For the quadrat method, users should assess how much of the quadrat is covered by the blades of the kelp species of interest. Because percent cover will change as water moves back and forth, care should be taken in areas with significant wave action. Users should aim to assess the cover when the kelp is vertical.
4.4.1.2 Unified Point Contact (UPC)
For the UPC method, divers or snorkelers collect data directly under the meter tape, every 0.5 m or 1 m. Data should be blindly recorded for this method to avoid bias. To do this, surveyors use a marked point, a dropped weight, or close their eyes and record the item immediately under a pointed finger. Data recorded includes substrate (e.g., sand or rock), living cover (e.g., sessile invertebrate or algae), and relief (height between the most shallow and most deep quadrats).
Divers or snorkelers can also take photographs and more robustly assess the percent cover using computer programs (e.g., CoralNet). As with the visual surveys, the photographs should be taken when the kelp is vertical and not when it is bent or swayed with the movement of the water.
Similarly, users may also swim the length of the transect with a video camera and assess the percent cover on the computer using a software program.
4.4.2 Basic Instructions for Kelp Percent Cover Measurement
4.4.2.1 Diver or Snorkel Surveys
Follow the instructions for the biodiversity video survey (Section 5.1.2.2). Percent cover may be analysed from the photo quadrats described in that section.
- Once you have obtained the photo quadrats, upload the images to an image viewing software, such as CoralNet or Coral Point Count. These resources allow use a semi-automated algorithm to analyse the photo quadrats. In short, you will assign points (randomly or systematically) to each image and then classify each point as kelp cover or an alternative category. The percentage of points that are kelp can be translated into percent cover.
Alternatively, follow the instructions from the biodiversity visual surveys (Section 5.1.2.1) and instead of taking photos, visually assess how much of the quadrat is covered by kelp and record this on your data sheet.
- As with the photo quadrats, assess how the kelp is swaying back and forth. Make your assessment when it is most vertical and stationary.
- This approach is recommended if you are only interested in percent cover. If you are collecting information on other variables (e.g., kelp, fish, and/or invertebrate diversities), the photo quadrat approach would be a more suitable approach.
4.4.2.2 Drop Cameras or Remote or Autonomous Vehicles
You may obtain videos or photos of the kelp forest using drop cameras or remote or autonomous vehicles.
Data collection steps for drop cameras/remote or autonomous vehicles are as follows:
- Survey across a transect.
- Select sampling or quadrat points.
- Take a photo quadrat or video still of the kelp forest from directly above the sea floor.
- Process the imagery as described above.
4.4.3 Projected Costs and comparison of methods
Each method of percent cover measurement has various associated costs (Table 11), as well as pros and cons for implementation (Table 12).
Table 11. Projected costs for percent cover measurement options.
| Method | Cost |
|---|---|
| SCUBA: Photo Quadrats | Low |
| SCUBA: Visual | Low |
| UPC | Low |
| Remote or Autonomous Video Surveys | Very High |
Table 12. Pros and cons for percent cover measurement options.
| Measurement Technique | Pros | Cons | Reference |
|---|---|---|---|
| Diver/Snorkel Visual Surveys | Lower cost Little processing time | Lower accuracy | Kelp Ecosystem Ecology Network, 2024 |
| Unified Point Contact (UPC) | Little equipment Easy to train | Requires taxonomic knowledge May require post-sampling processing time | Partnership for Interdisciplinary Studies of Coastal Oceans, 2023 |
| Diver/Snorkel Video Surveys | More accurate than visual | Higher cost than visual | Duffy et al., 2019 |
| Remote or Autonomous Video Surveys | Maybe able to sample larger distances Advances in AI may mean that processing can be done automatically Potential for highest accuracy | Most expensive percent cover measurement technique | Bewley et al., 2012 |
